
- Home >
- Stock Photos >
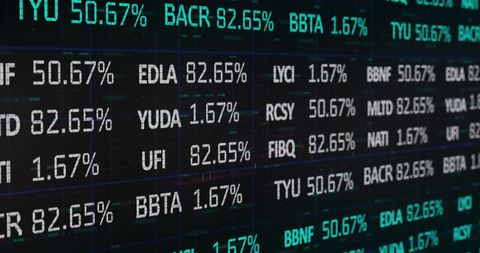
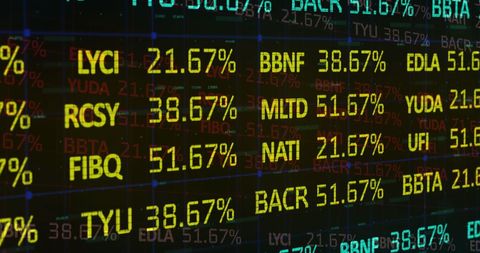
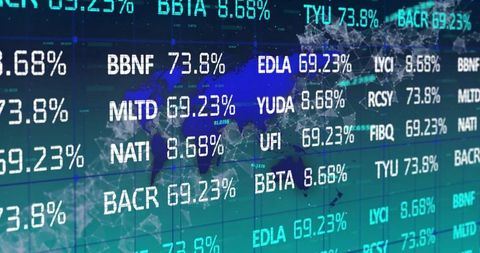
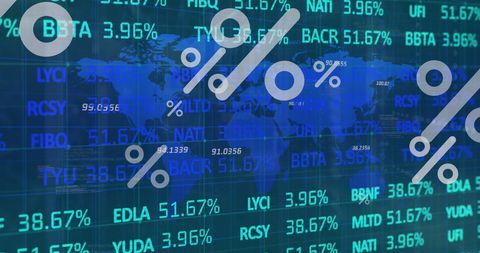
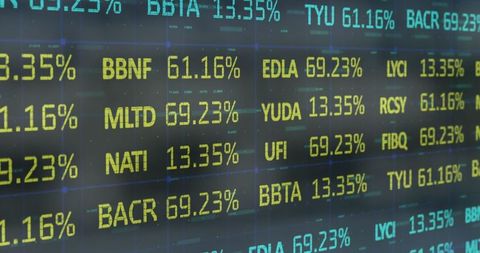
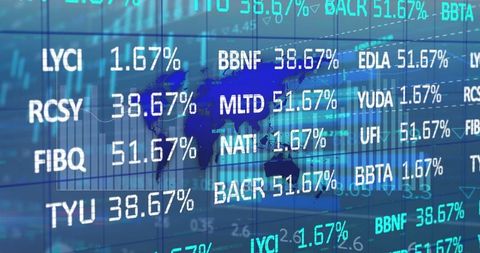
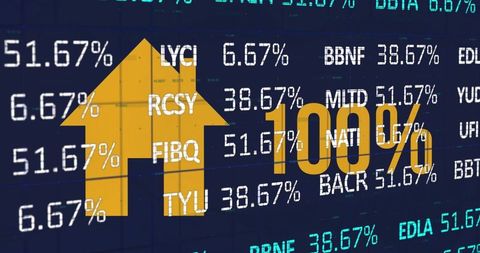
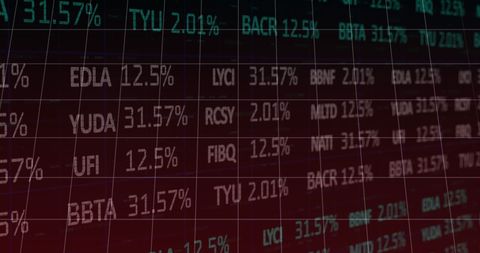
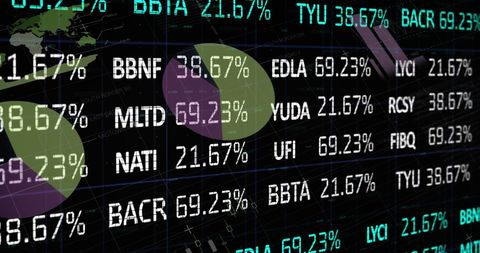
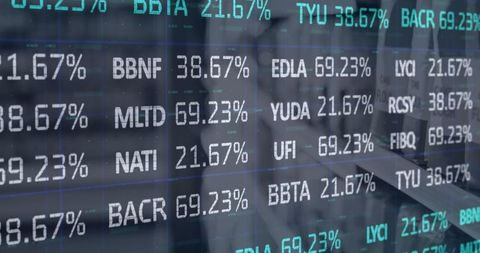
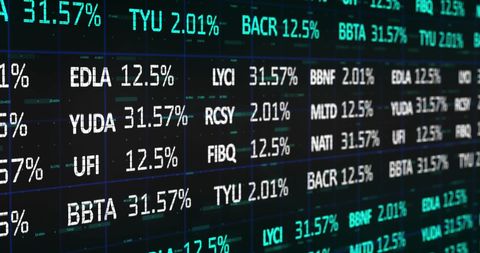
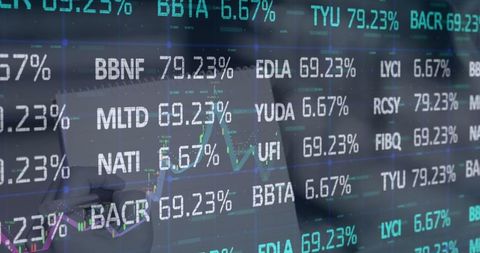
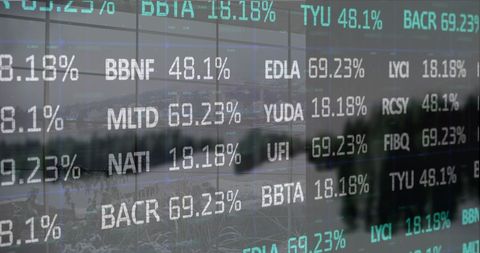
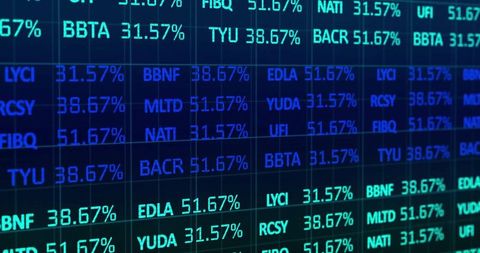
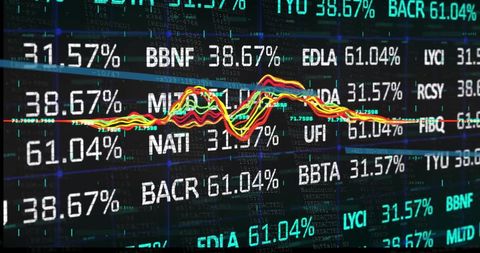
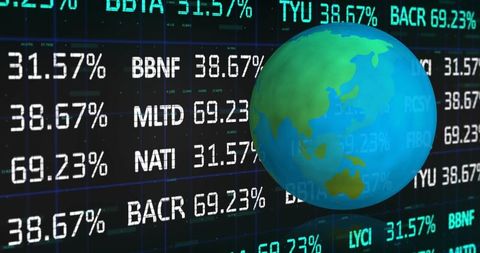
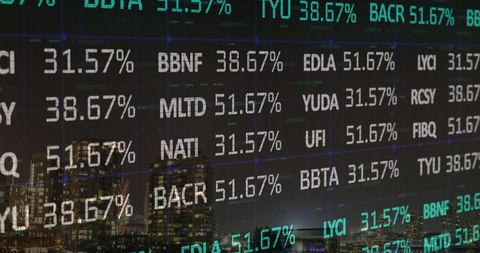
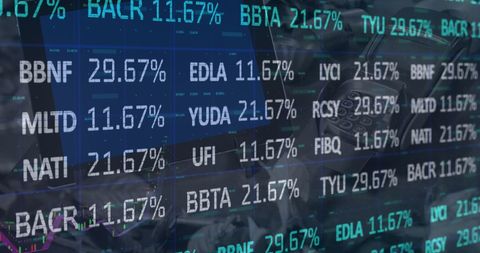
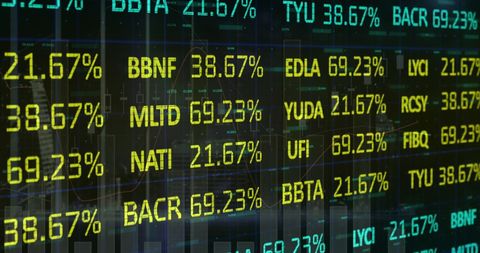
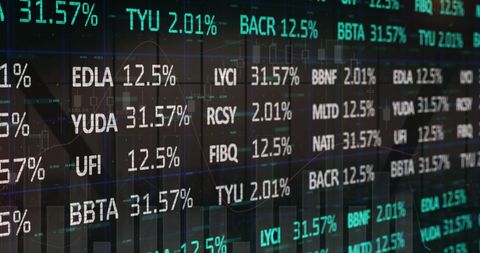
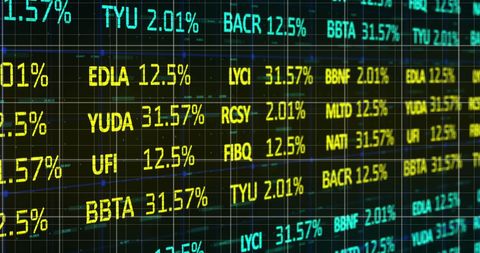
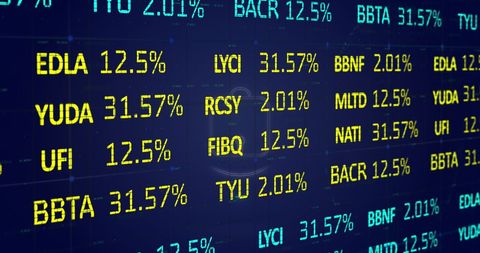
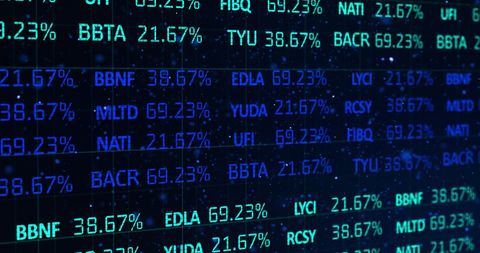
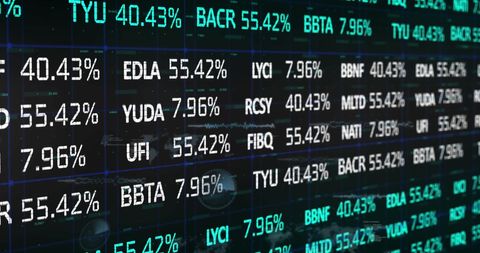
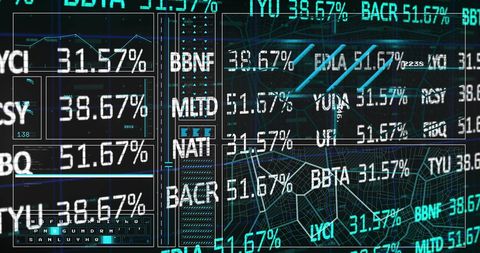
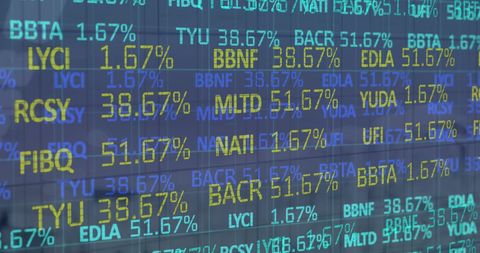
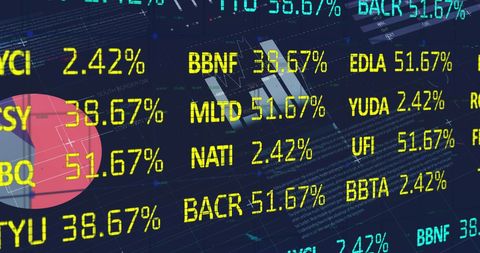
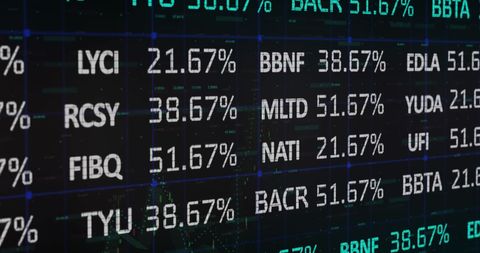
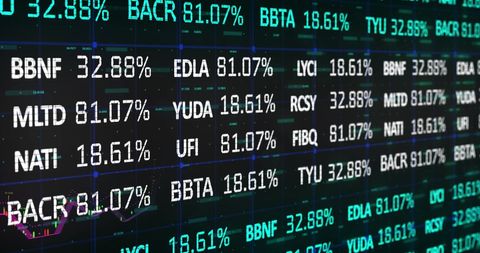
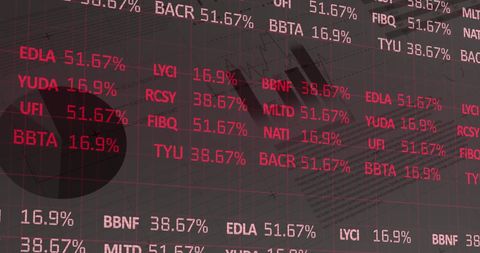
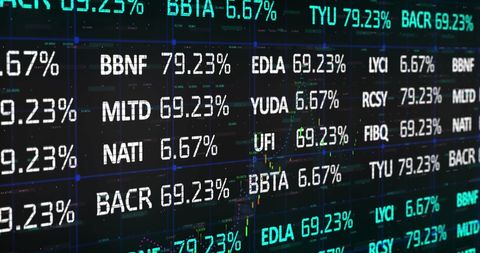
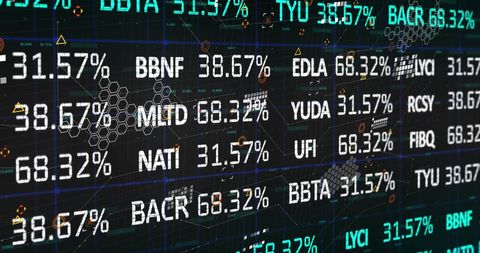
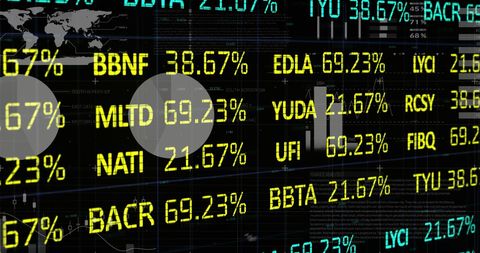
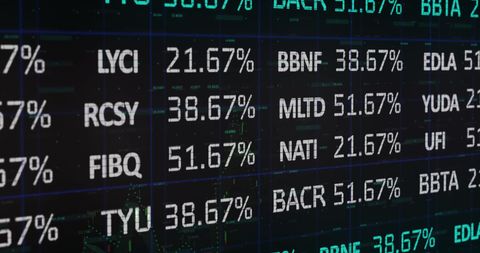
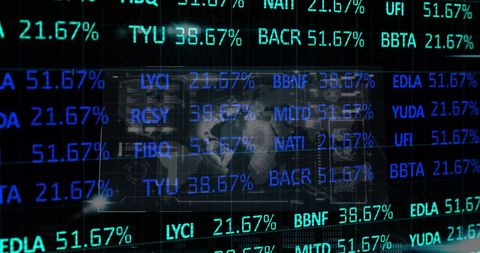
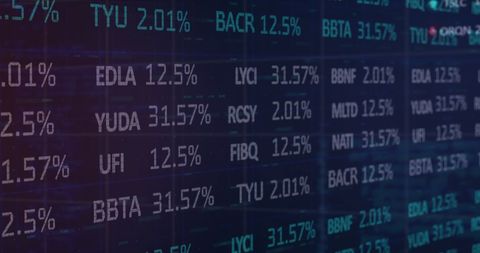
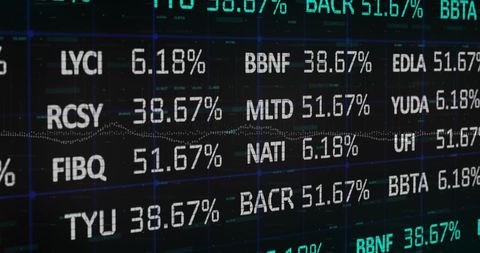
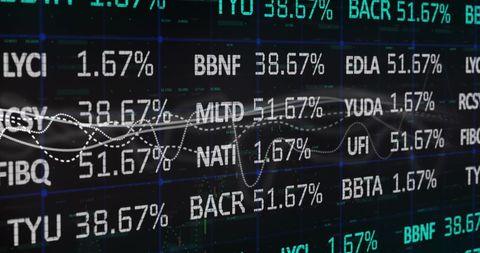
- Digital Animation Overlaying Stock Trading Screen Data Visualization
Digital Animation Overlaying Stock Trading Screen Data Visualization Image
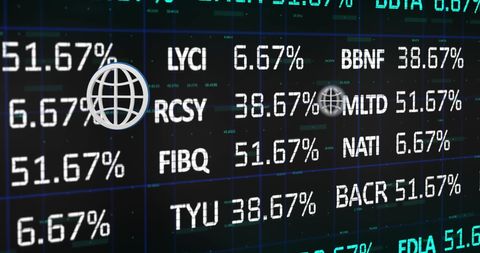
Dynamic illustration of global financial performance using stock trading screen data. Ideal for presentations on global economy trends, investment strategies, and enhancing presentations on financial data trends filtering. The moving globe icons signify globalization in stock trading.
Powered by 


downloads
Tags:
More
Credit Photo
If you would like to credit the Photo, here are some ways you can do so
Text Link
photo Link
<span class="text-link">
<span>
<a target="_blank" href=https://pikwizard.com/photo/digital-animation-overlaying-stock-trading-screen-data-visualization/dc400300dd51ccc81acf7fb3d7ee2a6e/>PikWizard</a>
</span>
</span>
<span class="image-link">
<span
style="margin: 0 0 20px 0; display: inline-block; vertical-align: middle; width: 100%;"
>
<a
target="_blank"
href="https://pikwizard.com/photo/digital-animation-overlaying-stock-trading-screen-data-visualization/dc400300dd51ccc81acf7fb3d7ee2a6e/"
style="text-decoration: none; font-size: 10px; margin: 0;"
>
<img src="https://pikwizard.com/pw/medium/dc400300dd51ccc81acf7fb3d7ee2a6e.jpg" style="margin: 0; width: 100%;" alt="" />
<p style="font-size: 12px; margin: 0;">PikWizard</p>
</a>
</span>
</span>
Free (free of charge)
Free for personal and commercial use.
Author: Awesome Content
Similar Free Stock Images
Premium

Premium


Premium


Premium


Premium


Premium


Premium

Premium


Premium

Premium

Premium


Premium


Premium

Premium


Premium


Premium

Premium


Premium

Premium

Premium


Premium

Premium


Premium

Premium

Premium


Explore More Free Stock Images