
- Home >
- Stock Photos >
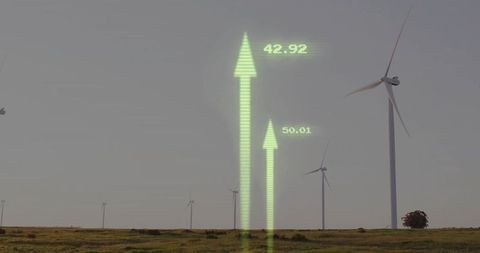
- Digital Arrows Displaying Holographic Data Visualization
Digital Arrows Displaying Holographic Data Visualization Image
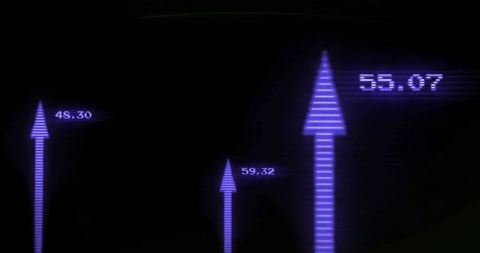
This futuristic display features digital arrows representing statistical growth, set against a dark background that creates a poignant contrast. Each arrow is accompanied by numerical data, hinting at dynamic financial or technological insights. Perfect for illustrating advanced data analytics, technological capabilities, or innovative design concepts in digital presentations, tech blogs, or marketing materials to engage an audience seeking modern innovation.
Powered by  - Get 15% off with code: PIKWIZARD15


downloads
Tags:
More
Credit Photo
If you would like to credit the Photo, here are some ways you can do so
Text Link
photo Link
<span class="text-link">
<span>
<a target="_blank" href=https://pikwizard.com/photo/digital-arrows-displaying-holographic-data-visualization/157afb6a1417d7ee5c36cc9e5f12381c/>PikWizard</a>
</span>
</span>
<span class="image-link">
<span
style="margin: 0 0 20px 0; display: inline-block; vertical-align: middle; width: 100%;"
>
<a
target="_blank"
href="https://pikwizard.com/photo/digital-arrows-displaying-holographic-data-visualization/157afb6a1417d7ee5c36cc9e5f12381c/"
style="text-decoration: none; font-size: 10px; margin: 0;"
>
<img src="https://pikwizard.com/pw/medium/157afb6a1417d7ee5c36cc9e5f12381c.jpg" style="margin: 0; width: 100%;" alt="" />
<p style="font-size: 12px; margin: 0;">PikWizard</p>
</a>
</span>
</span>
Free (free of charge)
Free for personal and commercial use.
Author: Awesome Content
Similar Free Stock Images

Premium


Premium


Premium


Premium


Premium


Premium


Premium


Premium


Premium


Premium


Premium


Premium


Premium

Premium


Premium


Premium


Premium


Premium

Premium


Premium


Premium

Premium


Premium

Premium


Premium


Explore More Free Stock Images