
- Home >
- Stock Photos >
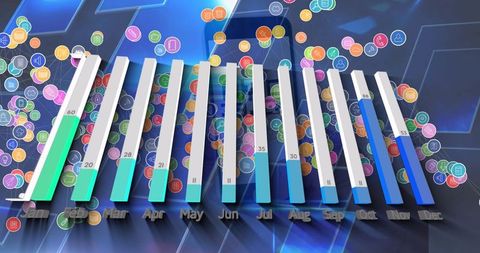
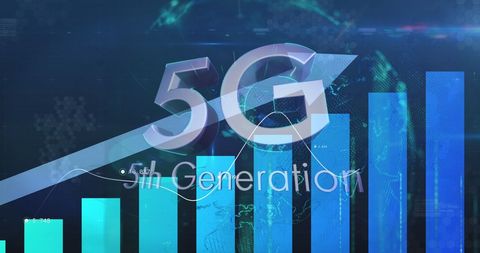
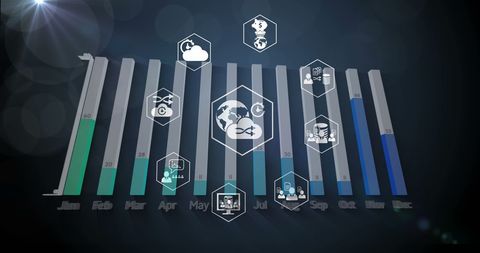
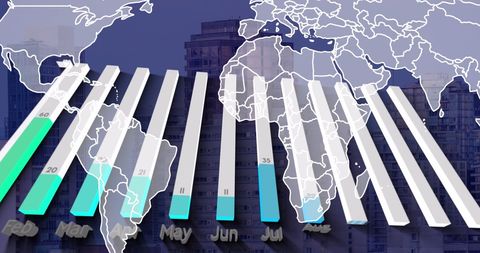
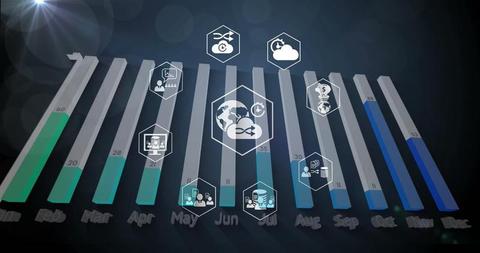
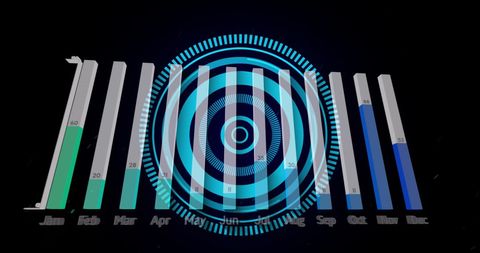
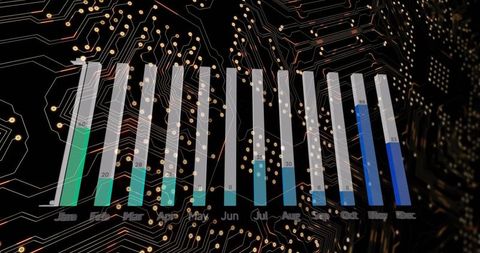
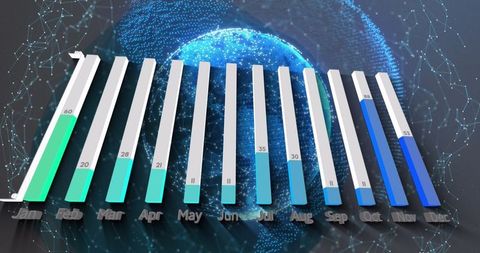
- Digital Bar Chart Data Visualization on Blue Background
Digital Bar Chart Data Visualization on Blue Background Image

Graphic showing a 3D bar chart representing data over a DNA strand laid over a gradient blue background. Suitable for illustrating concepts in data analysis, digital interfaces, genetic research visualization, and high-tech industries. Useful for presentations on technological advancements, scientific publications, and educational materials focusing on data tracking and global technology shifts.
Powered by 


downloads
Tags:
More
Credit Photo
If you would like to credit the Photo, here are some ways you can do so
Text Link
photo Link
<span class="text-link">
<span>
<a target="_blank" href=https://pikwizard.com/photo/digital-bar-chart-data-visualization-on-blue-background/940b22c0d81162330122077bb2ceae95/>PikWizard</a>
</span>
</span>
<span class="image-link">
<span
style="margin: 0 0 20px 0; display: inline-block; vertical-align: middle; width: 100%;"
>
<a
target="_blank"
href="https://pikwizard.com/photo/digital-bar-chart-data-visualization-on-blue-background/940b22c0d81162330122077bb2ceae95/"
style="text-decoration: none; font-size: 10px; margin: 0;"
>
<img src="https://pikwizard.com/pw/medium/940b22c0d81162330122077bb2ceae95.jpg" style="margin: 0; width: 100%;" alt="" />
<p style="font-size: 12px; margin: 0;">PikWizard</p>
</a>
</span>
</span>
Free (free of charge)
Free for personal and commercial use.
Author: Creative Art
Similar Free Stock Images
Premium


Premium


Premium


Premium


Premium


Premium


Premium


Premium

Premium


Premium


Premium

Premium


Premium


Premium


Premium


Premium


Premium


Premium


Premium


Premium


Premium


Premium

Premium


Premium

Premium


Explore More Free Stock Images