
- Home >
- Stock Photos >
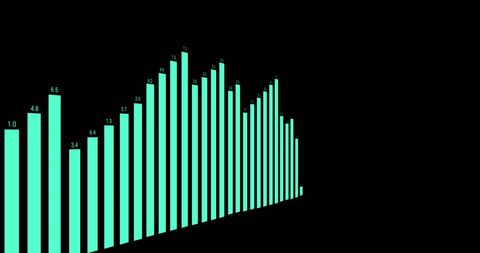
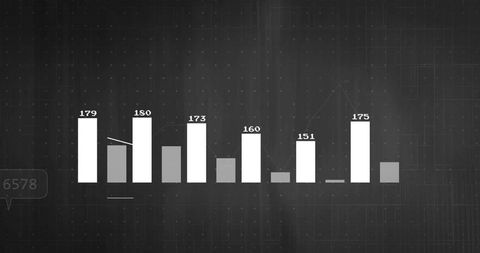
- Digital Bar Chart Display on Dark Grid Background
Digital Bar Chart Display on Dark Grid Background Image

Ideal for presentations conveying complex statistical data or analysis. Useful in educational and business contexts to illustrate concepts of data processing and interpretation. Suitable for backgrounds in technology-themed materials and online content focused on analytics.
Powered by  - Get 15% off with code: PIKWIZARD15


downloads
Tags:
More
Credit Photo
If you would like to credit the Photo, here are some ways you can do so
Text Link
photo Link
<span class="text-link">
<span>
<a target="_blank" href=https://pikwizard.com/photo/digital-bar-chart-display-on-dark-grid-background/8163770728d5828c8df93e1c96313b8d/>PikWizard</a>
</span>
</span>
<span class="image-link">
<span
style="margin: 0 0 20px 0; display: inline-block; vertical-align: middle; width: 100%;"
>
<a
target="_blank"
href="https://pikwizard.com/photo/digital-bar-chart-display-on-dark-grid-background/8163770728d5828c8df93e1c96313b8d/"
style="text-decoration: none; font-size: 10px; margin: 0;"
>
<img src="https://pikwizard.com/pw/medium/8163770728d5828c8df93e1c96313b8d.jpg" style="margin: 0; width: 100%;" alt="" />
<p style="font-size: 12px; margin: 0;">PikWizard</p>
</a>
</span>
</span>
Free (free of charge)
Free for personal and commercial use.
Author: Authentic Images
Similar Free Stock Images

Premium


Premium


Premium


Premium


Premium


Premium


Premium


Premium


Premium

Premium


Premium

Premium


Premium


Premium


Premium


Premium


Premium


Premium

Premium


Premium


Premium


Premium


Premium


Premium


Premium


Explore More Free Stock Images