
- Home >
- Stock Photos >
- Digital Bar Chart with Trend Lines and Data Analytics Display
Digital Bar Chart with Trend Lines and Data Analytics Display Image
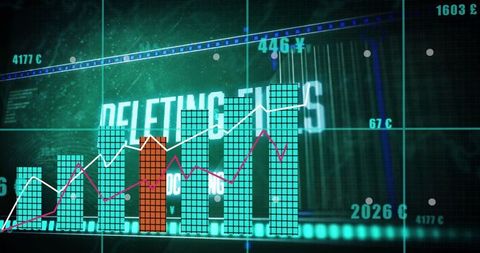
This graphic showcases a digital bar chart featuring cyan bars with a prominent red-orange highlighted segment. Two trend lines overlay the chart, offering insight into data tendencies. The background includes subtle markings of monetary values, enhancing the financial analysis aura. Ideal for usage in reports, presentations, or websites related to finance, analytics, business intelligence, and infographic elements. Aids in visual storytelling and effective communication of complex data insights.

downloads
Tags:
More
Credit Photo
If you would like to credit the Photo, here are some ways you can do so
Text Link
photo Link
<span class="text-link">
<span>
<a target="_blank" href=https://pikwizard.com/photo/digital-bar-chart-with-trend-lines-and-data-analytics-display/ca017179af2bfeab774a6ad1f11c406c/>PikWizard</a>
</span>
</span>
<span class="image-link">
<span
style="margin: 0 0 20px 0; display: inline-block; vertical-align: middle; width: 100%;"
>
<a
target="_blank"
href="https://pikwizard.com/photo/digital-bar-chart-with-trend-lines-and-data-analytics-display/ca017179af2bfeab774a6ad1f11c406c/"
style="text-decoration: none; font-size: 10px; margin: 0;"
>
<img src="https://pikwizard.com/pw/medium/ca017179af2bfeab774a6ad1f11c406c.jpg" style="margin: 0; width: 100%;" alt="" />
<p style="font-size: 12px; margin: 0;">PikWizard</p>
</a>
</span>
</span>
Free (free of charge)
Free for personal and commercial use.
Author: Creative Art