
- Home >
- Stock Photos >
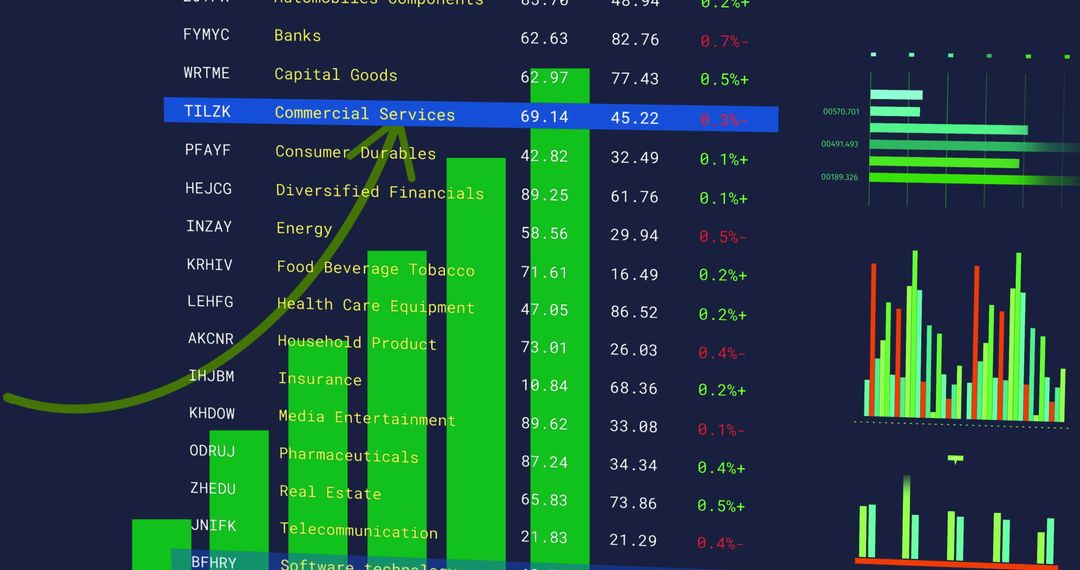
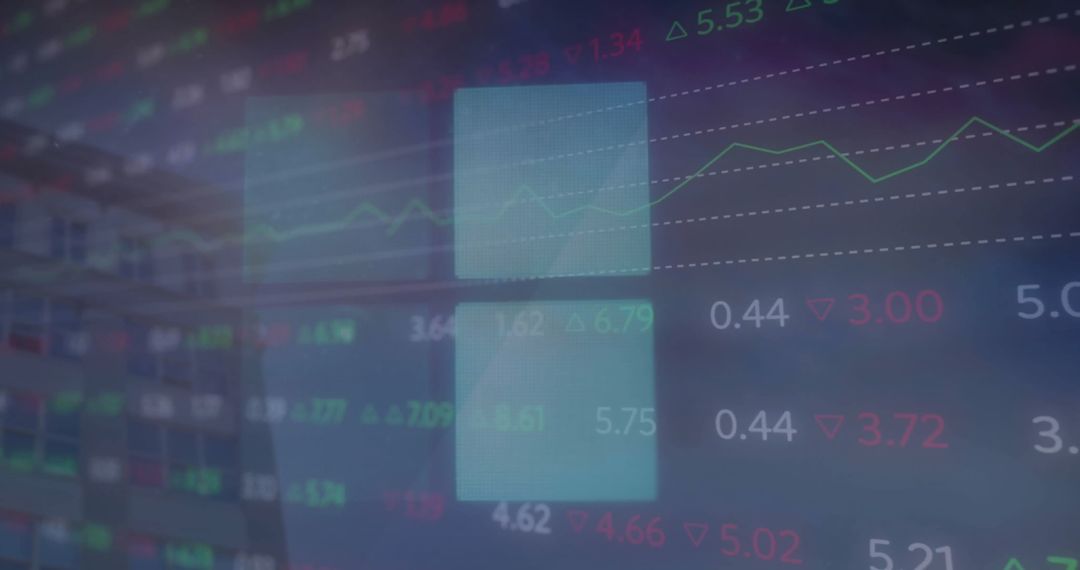
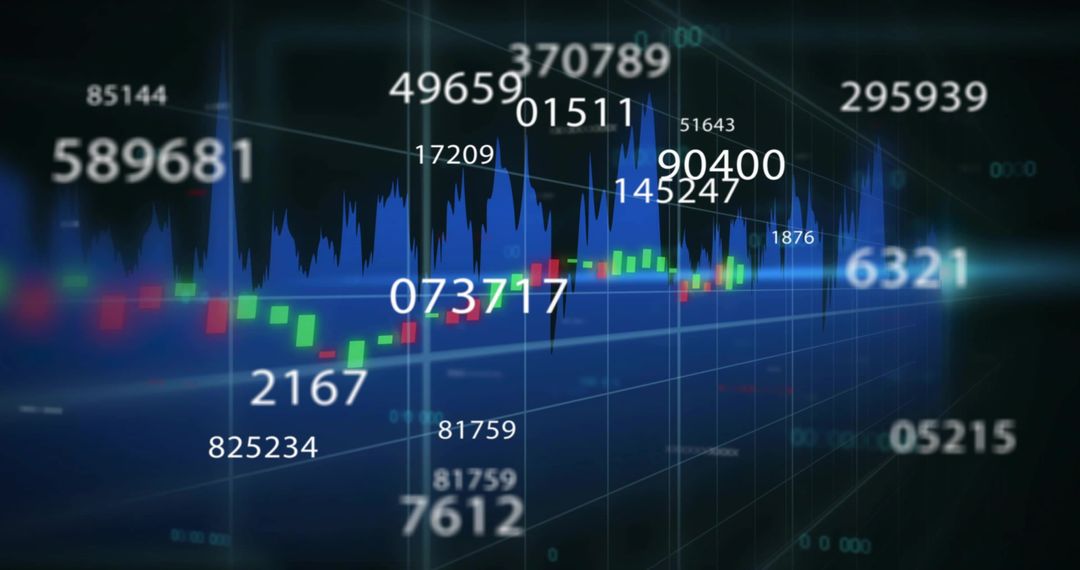
- Digital Bar Graph Display in Financial Data Analysis
Digital Bar Graph Display in Financial Data Analysis Image

Bar graph lit against statistical numbers and data creates impression of dynamic financial analysis. Ideal for illustrating stock market fluctuations or technology-driven investment insights. Useful in presentations detailing market performance or data processing technologies at business conferences.
Powered by 


2
downloads
downloads
Tags:
More
Credit Photo
If you would like to credit the Photo, here are some ways you can do so
Text Link
photo Link
<span class="text-link">
<span>
<a target="_blank" href=https://pikwizard.com/photo/digital-bar-graph-display-in-financial-data-analysis/eb8a1c73356a794730faca412b928292/>PikWizard</a>
</span>
</span>
<span class="image-link">
<span
style="margin: 0 0 20px 0; display: inline-block; vertical-align: middle; width: 100%;"
>
<a
target="_blank"
href="https://pikwizard.com/photo/digital-bar-graph-display-in-financial-data-analysis/eb8a1c73356a794730faca412b928292/"
style="text-decoration: none; font-size: 10px; margin: 0;"
>
<img src="https://pikwizard.com/pw/medium/eb8a1c73356a794730faca412b928292.jpg" style="margin: 0; width: 100%;" alt="" />
<p style="font-size: 12px; margin: 0;">PikWizard</p>
</a>
</span>
</span>
Free (free of charge)
Free for personal and commercial use.
Author: Awesome Content
Similar Free Stock Images

Premium


Premium


Premium


Premium


Premium


Premium


Premium


Premium


Premium


Premium


Premium


Premium


Premium


Premium


Premium


Premium


Premium


Premium


Premium


Premium


Premium


Premium


Premium


Premium

