
- Home >
- Stock Photos >
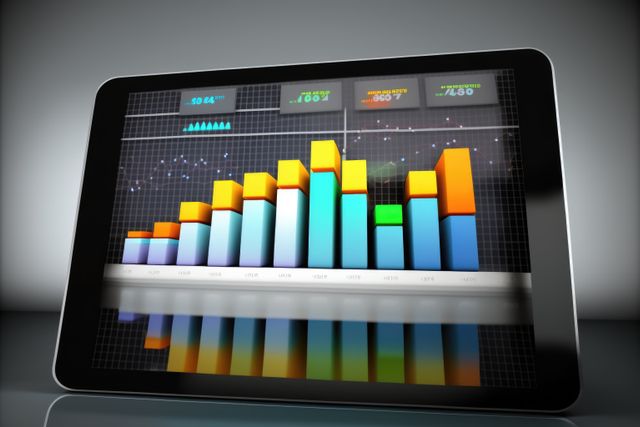
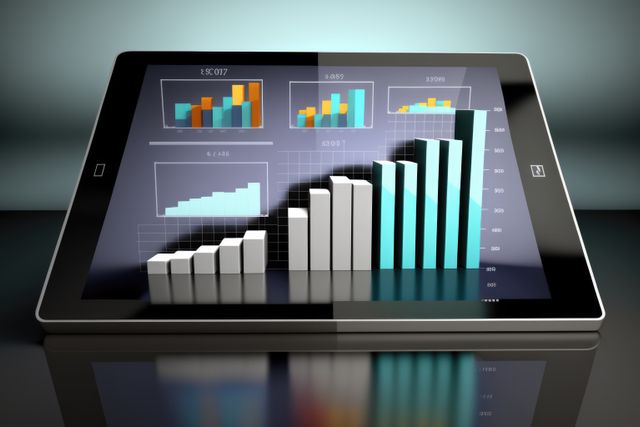
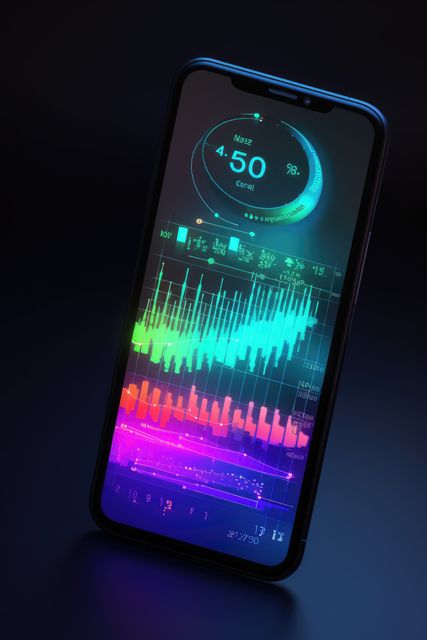
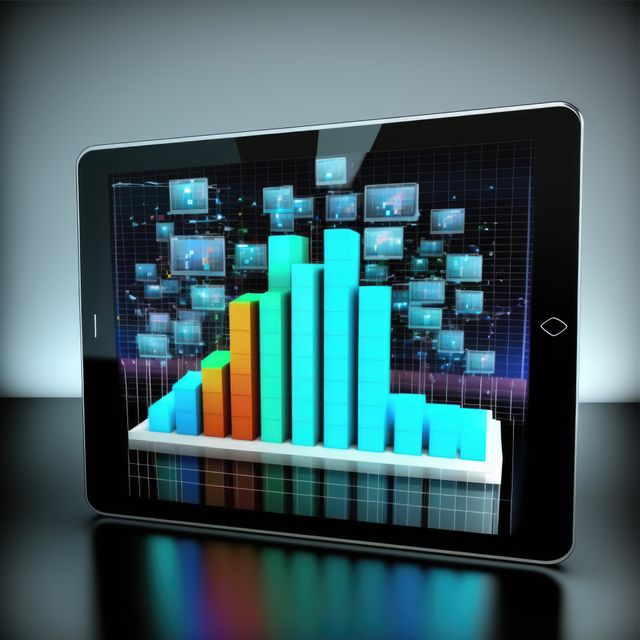
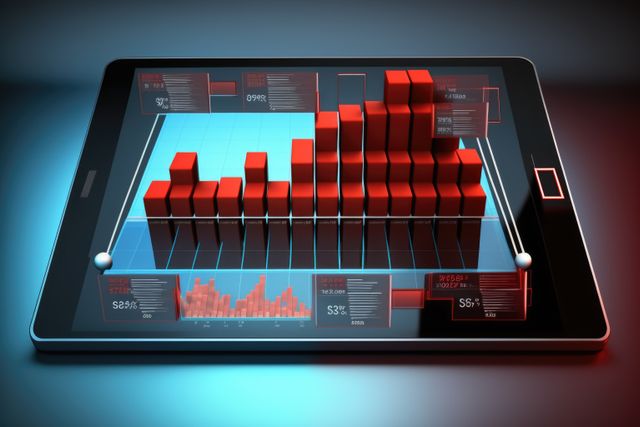
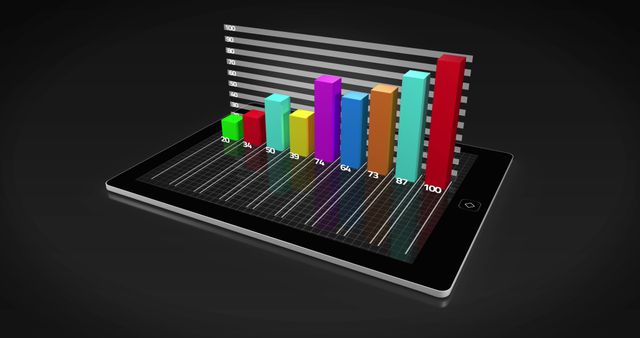
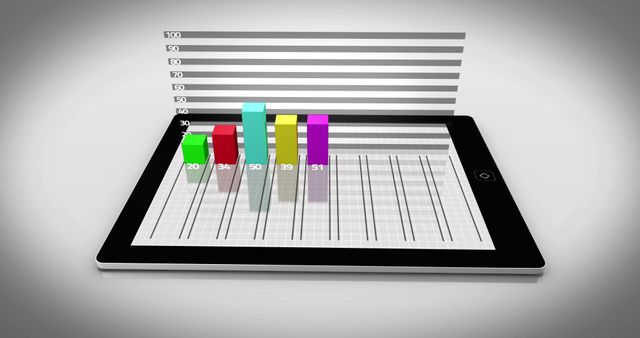
- Digital Bar Graph Display on Tablet Screen
Digital Bar Graph Display on Tablet Screen Image
AI
AI Generated Image. Digital bar graph display on a tablet indicates modern methods of representing statistics, making it useful for business analytics, technology demonstrations, online presentations, or educational content highlighting technology advancements and data-centric strategies.

downloads
Tags:
More
Credit Photo
If you would like to credit the Photo, here are some ways you can do so
Text Link
photo Link
<span class="text-link">
<span>
<a target="_blank" href=https://pikwizard.com/photo/digital-bar-graph-display-on-tablet-screen/20cbb163bd01810974383a8a3a0744ab/>PikWizard</a>
</span>
</span>
<span class="image-link">
<span
style="margin: 0 0 20px 0; display: inline-block; vertical-align: middle; width: 100%;"
>
<a
target="_blank"
href="https://pikwizard.com/photo/digital-bar-graph-display-on-tablet-screen/20cbb163bd01810974383a8a3a0744ab/"
style="text-decoration: none; font-size: 10px; margin: 0;"
>
<img src="https://pikwizard.com/pw/medium/20cbb163bd01810974383a8a3a0744ab.jpg" style="margin: 0; width: 100%;" alt="" />
<p style="font-size: 12px; margin: 0;">PikWizard</p>
</a>
</span>
</span>
Free (free of charge)
Free for personal and commercial use.
Author: AI Creator
Similar Free Stock Images


AI


AI
AI

AI
AI


AI
AI


AI


AI


AI


AI

AI

AI

AI


AI


AI


AI


AI


AI
AI


AI


Explore More Free Stock Images