- Home >
- Stock Photos >
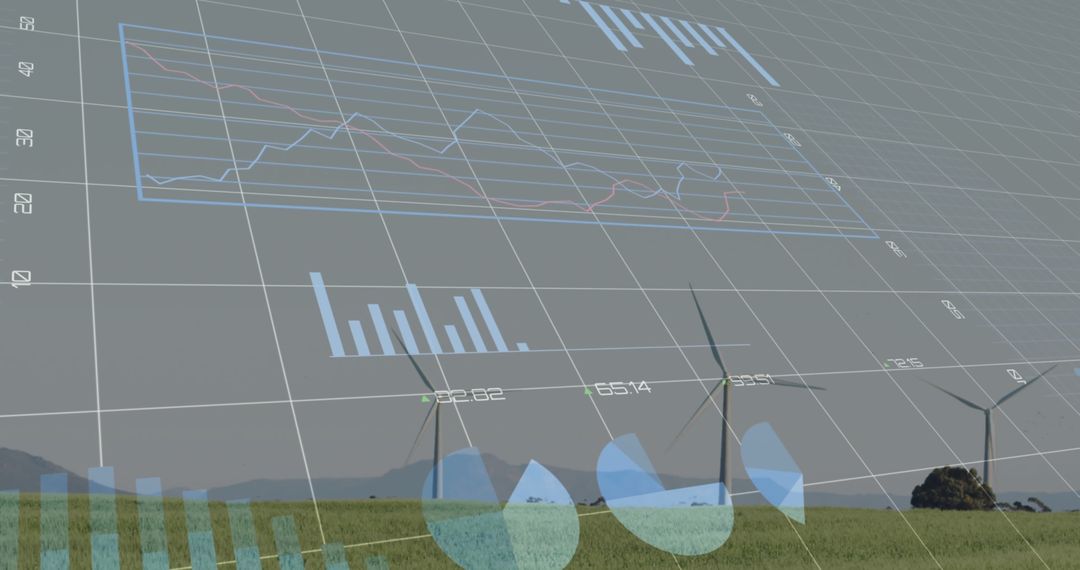
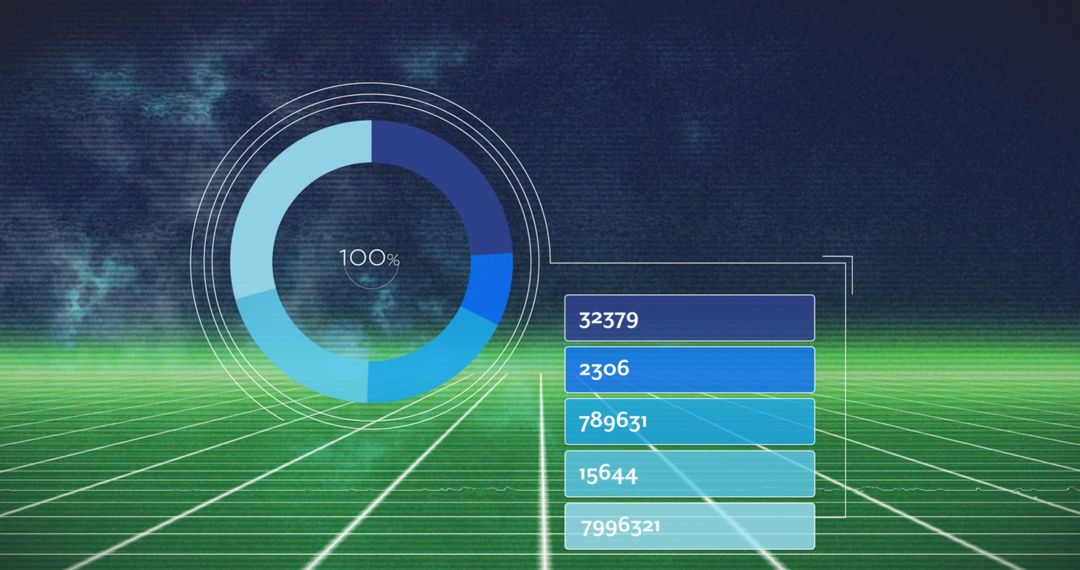
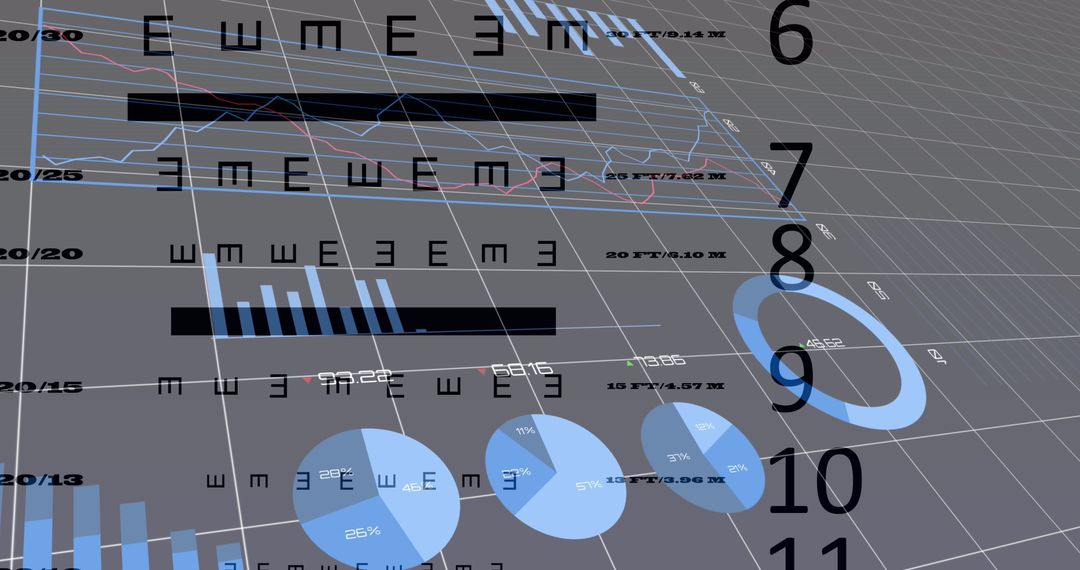
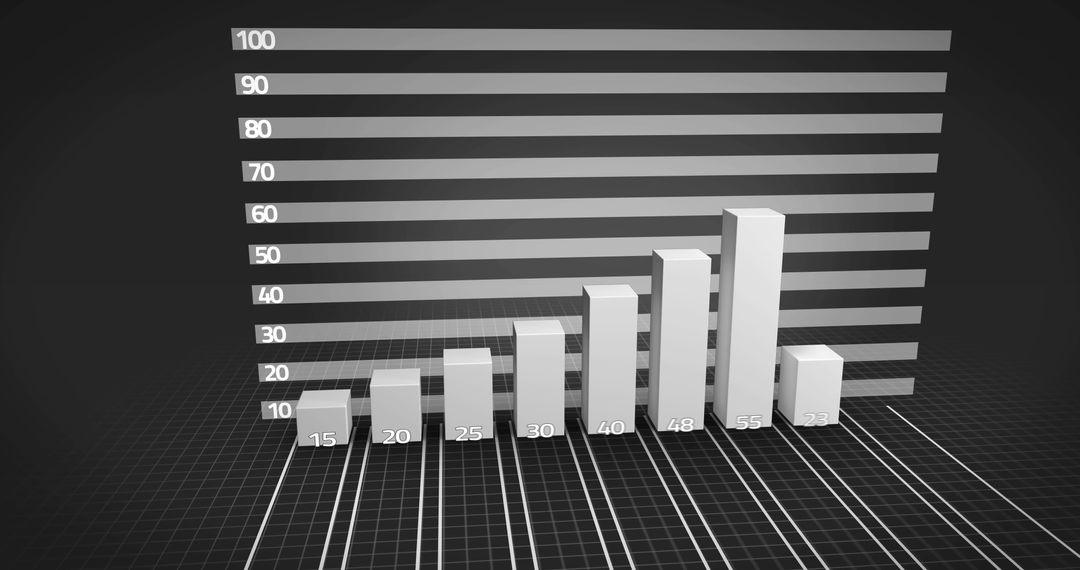
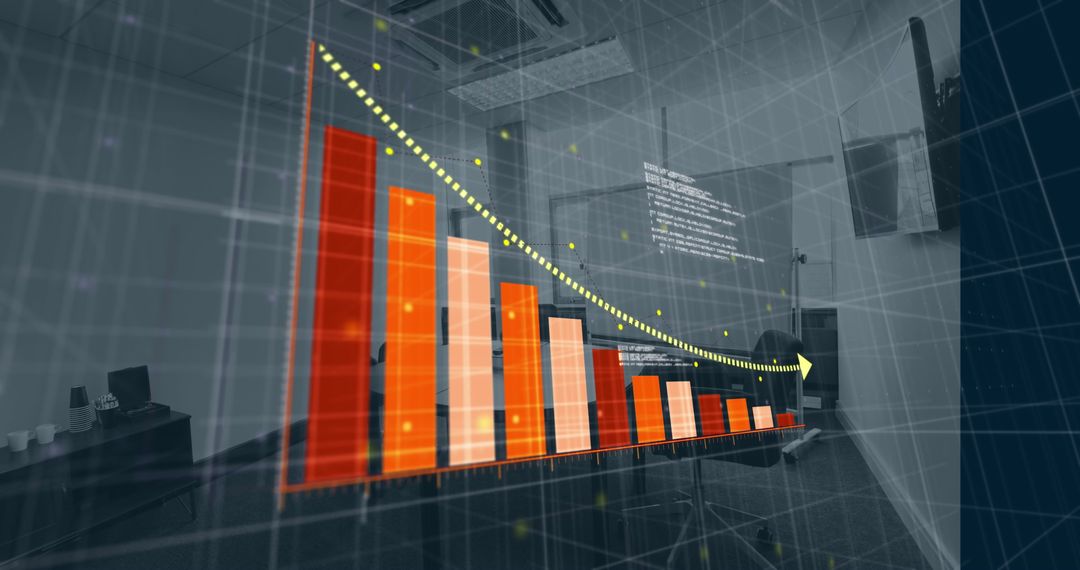
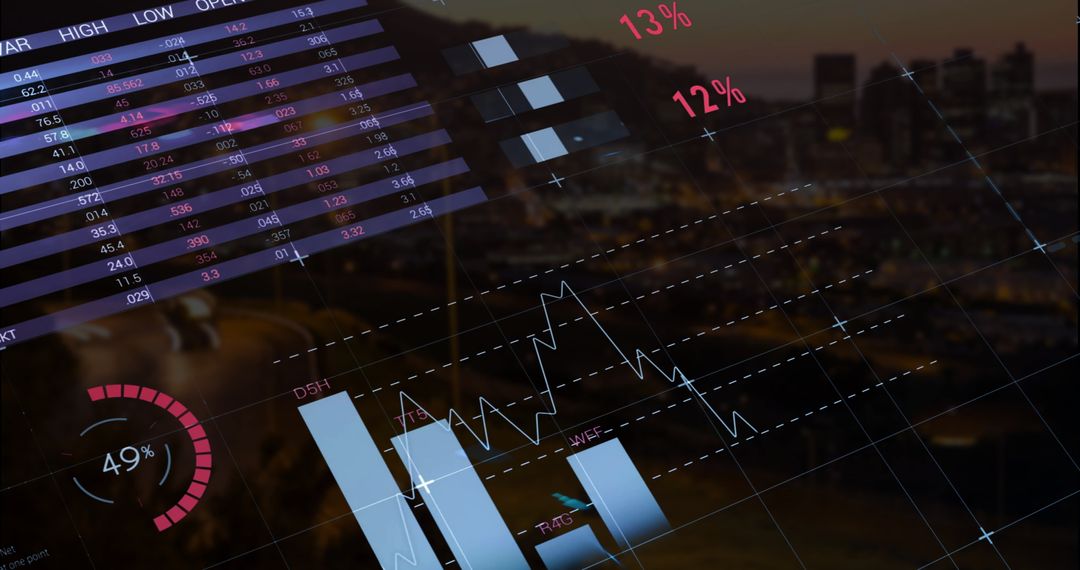
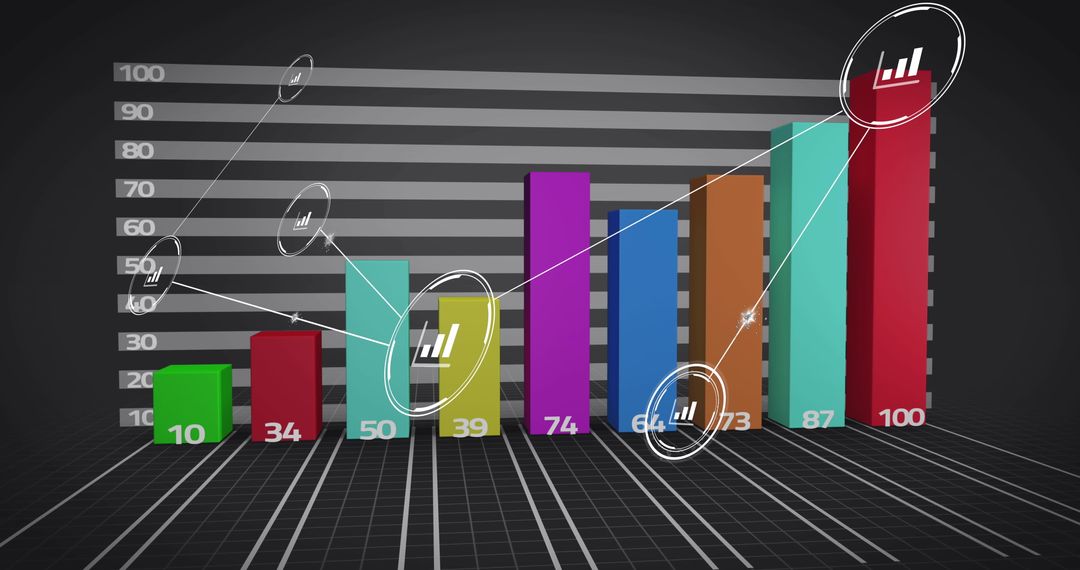
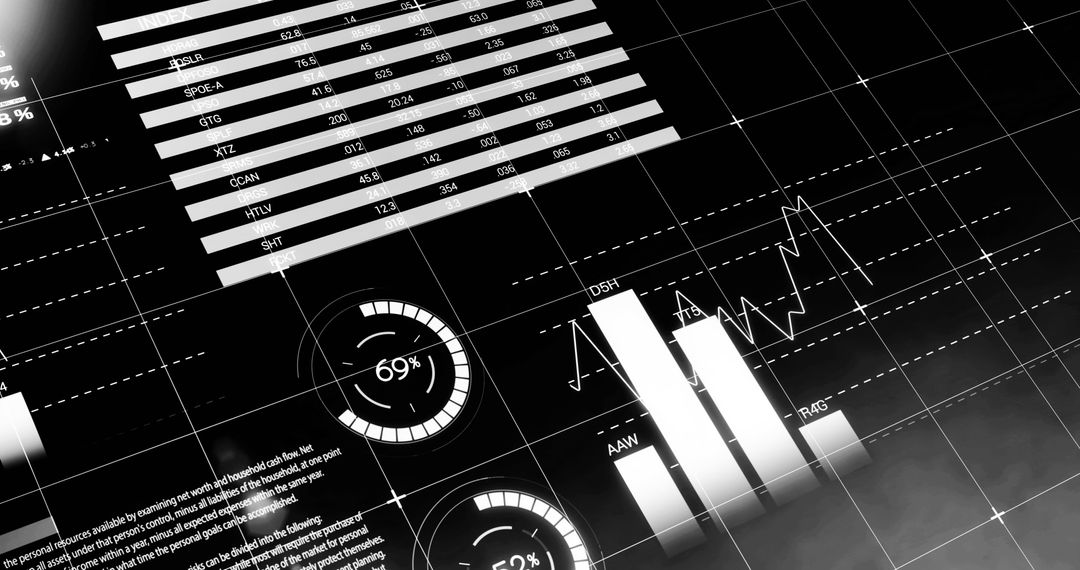
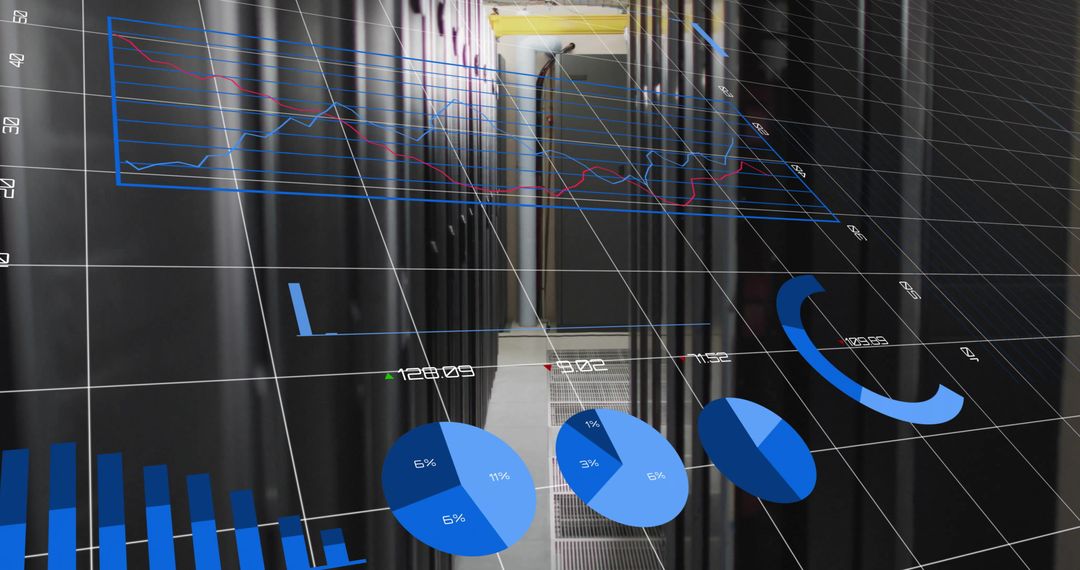
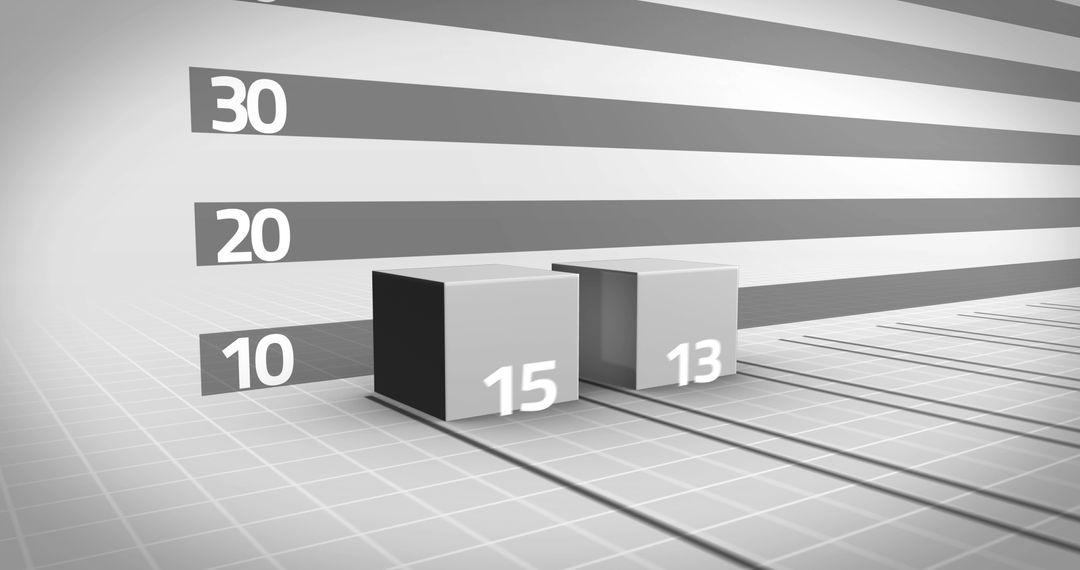
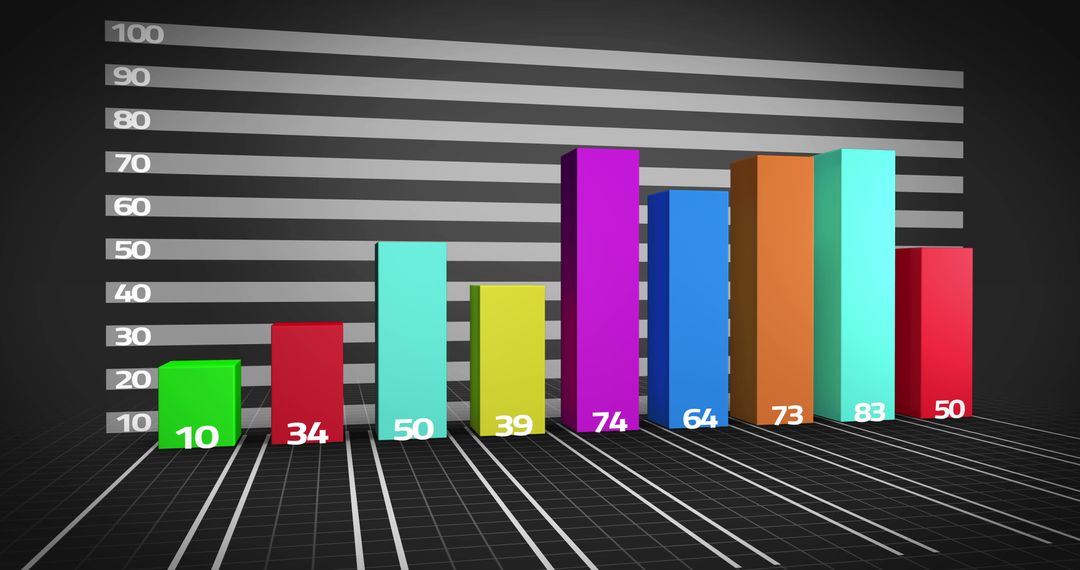
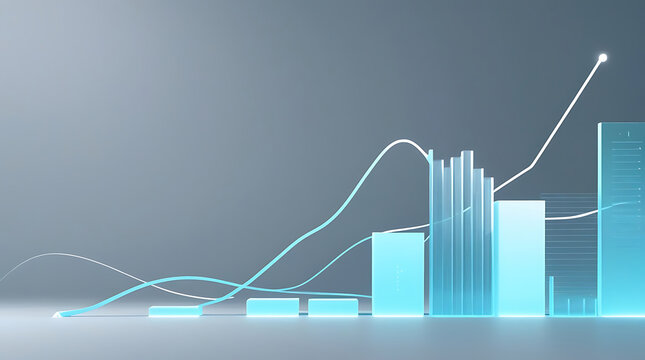
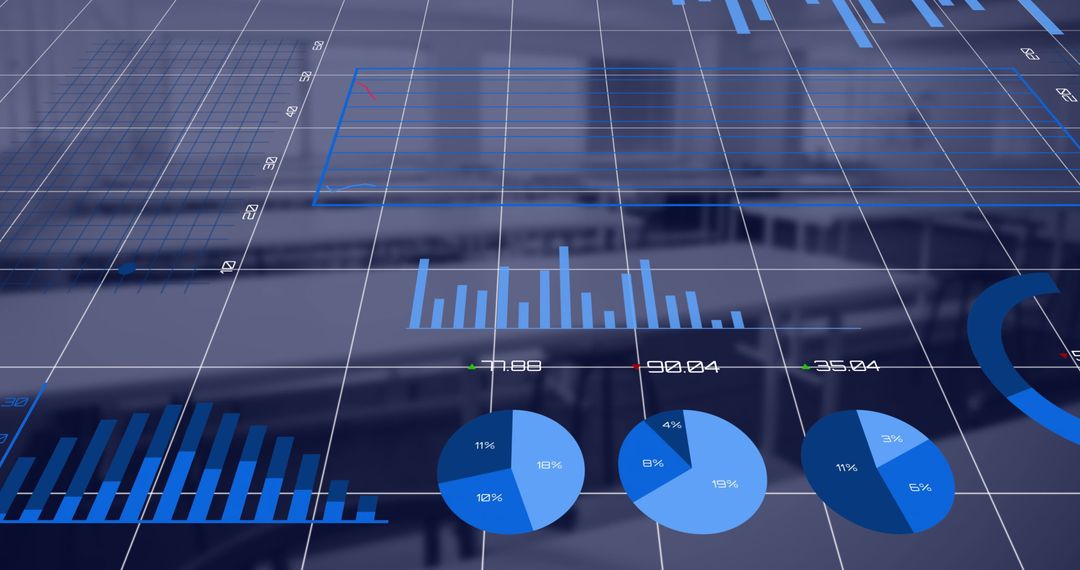
- Digital Bar Graph Illustrating Business Data Analysis
Digital Bar Graph Illustrating Business Data Analysis Image
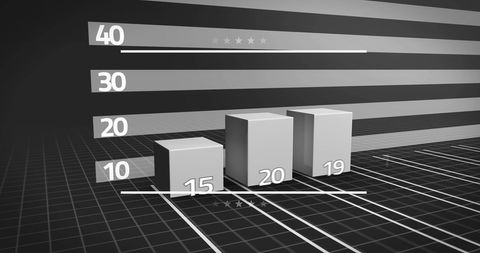
Visualizing essential business statistics and numerical data with three-dimensional effect on a subtle, high-contrast black background. Ideal for presentations on financial trends, business reports, innovative technology solutions, and educational materials seeking to demonstrate robust data analysis methods.
Powered by 


2
downloads
downloads
Tags:
More
Credit Photo
If you would like to credit the Photo, here are some ways you can do so
Text Link
photo Link
<span class="text-link">
<span>
<a target="_blank" href=https://pikwizard.com/photo/digital-bar-graph-illustrating-business-data-analysis/eb90b5abf2738d1d7ba02c05a6a04a68/>PikWizard</a>
</span>
</span>
<span class="image-link">
<span
style="margin: 0 0 20px 0; display: inline-block; vertical-align: middle; width: 100%;"
>
<a
target="_blank"
href="https://pikwizard.com/photo/digital-bar-graph-illustrating-business-data-analysis/eb90b5abf2738d1d7ba02c05a6a04a68/"
style="text-decoration: none; font-size: 10px; margin: 0;"
>
<img src="https://pikwizard.com/pw/medium/eb90b5abf2738d1d7ba02c05a6a04a68.jpg" style="margin: 0; width: 100%;" alt="" />
<p style="font-size: 12px; margin: 0;">PikWizard</p>
</a>
</span>
</span>
Free (free of charge)
Free for personal and commercial use.
Author: Awesome Content
Similar Free Stock Images

Premium


Premium


Premium


Premium


Premium

Premium


Premium


Premium


Premium


Premium


Premium


Premium


Premium


Premium


Premium


Premium


Premium


Premium


Premium


Premium


Premium


Premium


Premium


Premium