
- Home >
- Stock Photos >
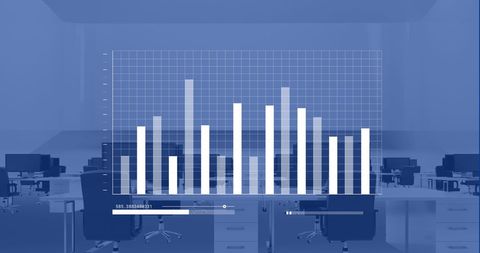
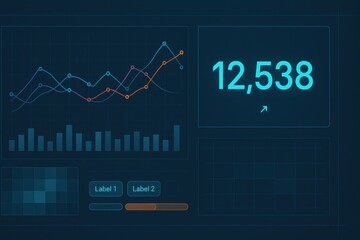
- Digital Bar Graph with Blue Background Indicating Data Analysis
Digital Bar Graph with Blue Background Indicating Data Analysis Image

Digital bar graph with blue background highlighting data processing and analysis. This image is ideal for presentations and reports focused on data-driven insights. The depiction of a digital interface suits content related to business analytics, global communication, and statistical evaluation. Useful for illustrating concepts such as connectivity and the impact of networking in today's digital world.
Powered by 


downloads
Tags:
More
Credit Photo
If you would like to credit the Photo, here are some ways you can do so
Text Link
photo Link
<span class="text-link">
<span>
<a target="_blank" href=https://pikwizard.com/photo/digital-bar-graph-with-blue-background-indicating-data-analysis/d35fcba8f133058a57f88d886e757190/>PikWizard</a>
</span>
</span>
<span class="image-link">
<span
style="margin: 0 0 20px 0; display: inline-block; vertical-align: middle; width: 100%;"
>
<a
target="_blank"
href="https://pikwizard.com/photo/digital-bar-graph-with-blue-background-indicating-data-analysis/d35fcba8f133058a57f88d886e757190/"
style="text-decoration: none; font-size: 10px; margin: 0;"
>
<img src="https://pikwizard.com/pw/medium/d35fcba8f133058a57f88d886e757190.jpg" style="margin: 0; width: 100%;" alt="" />
<p style="font-size: 12px; margin: 0;">PikWizard</p>
</a>
</span>
</span>
Free (free of charge)
Free for personal and commercial use.
Author: Creative Art
Similar Free Stock Images

Premium


Premium

Premium


Premium


Premium


Premium


Premium


Premium


Premium


Premium

Premium


Premium


Premium


Premium


Premium


Premium


Premium


Premium


Premium


Premium


Premium


Premium


Premium


Premium


Premium


Explore More Free Stock Images