
- Home >
- Stock Photos >
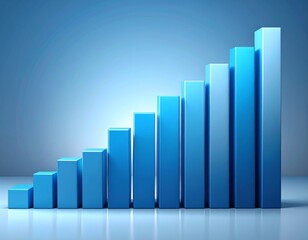
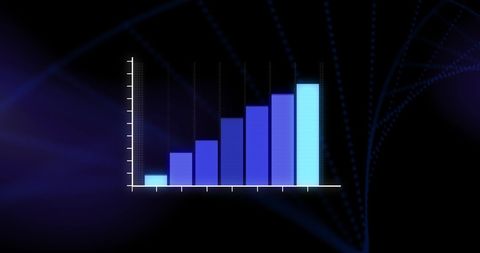
- Digital Bar Graph with Blue Data Visualization
Digital Bar Graph with Blue Data Visualization Image

Digital bar graph with varying shades of blue on a blue background. Useful for presentations on data analysis, financial reports, technology trends, or statistics. Can enhance materials related to digital technology and data environments.
Powered by 


downloads
Tags:
Credit Photo
If you would like to credit the Photo, here are some ways you can do so
Text Link
photo Link
<span class="text-link">
<span>
<a target="_blank" href=https://pikwizard.com/photo/digital-bar-graph-with-blue-data-visualization/80161fb36dba9a7afc5b227e2259394f/>PikWizard</a>
</span>
</span>
<span class="image-link">
<span
style="margin: 0 0 20px 0; display: inline-block; vertical-align: middle; width: 100%;"
>
<a
target="_blank"
href="https://pikwizard.com/photo/digital-bar-graph-with-blue-data-visualization/80161fb36dba9a7afc5b227e2259394f/"
style="text-decoration: none; font-size: 10px; margin: 0;"
>
<img src="https://pikwizard.com/pw/medium/80161fb36dba9a7afc5b227e2259394f.jpg" style="margin: 0; width: 100%;" alt="" />
<p style="font-size: 12px; margin: 0;">PikWizard</p>
</a>
</span>
</span>
Free (free of charge)
Free for personal and commercial use.
Author: Creative Art
Similar Free Stock Images

Premium


Premium


Premium


Premium


Premium


Premium


Premium


Premium

Premium

Premium


Premium


AI


Premium


Premium


Premium

Premium


Premium


Premium


Premium


Premium


Premium


Premium


Premium


Premium

Premium

Premium


Explore More Free Stock Images