- Home >
- Stock Photos >
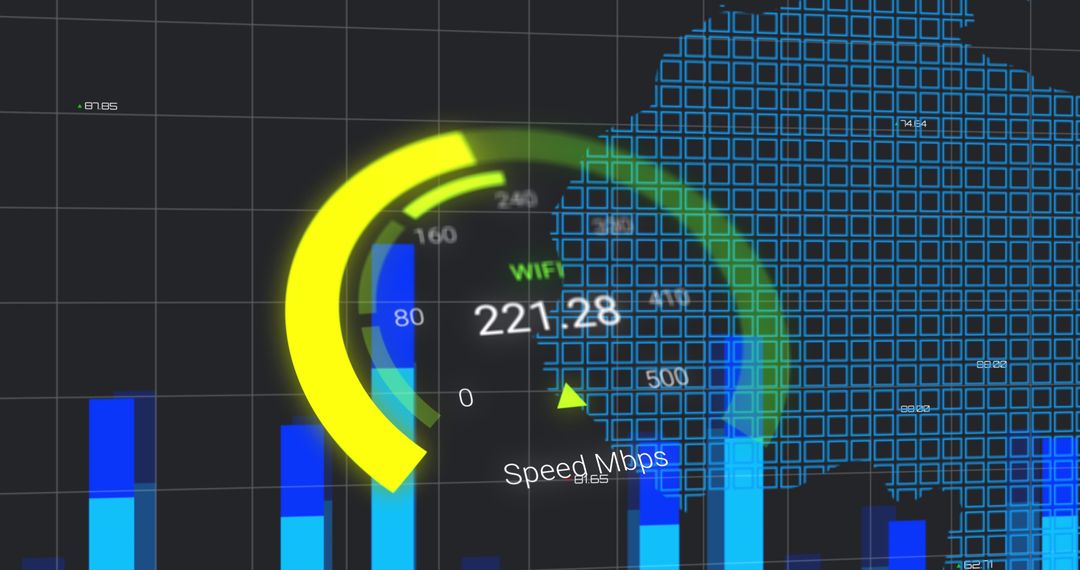
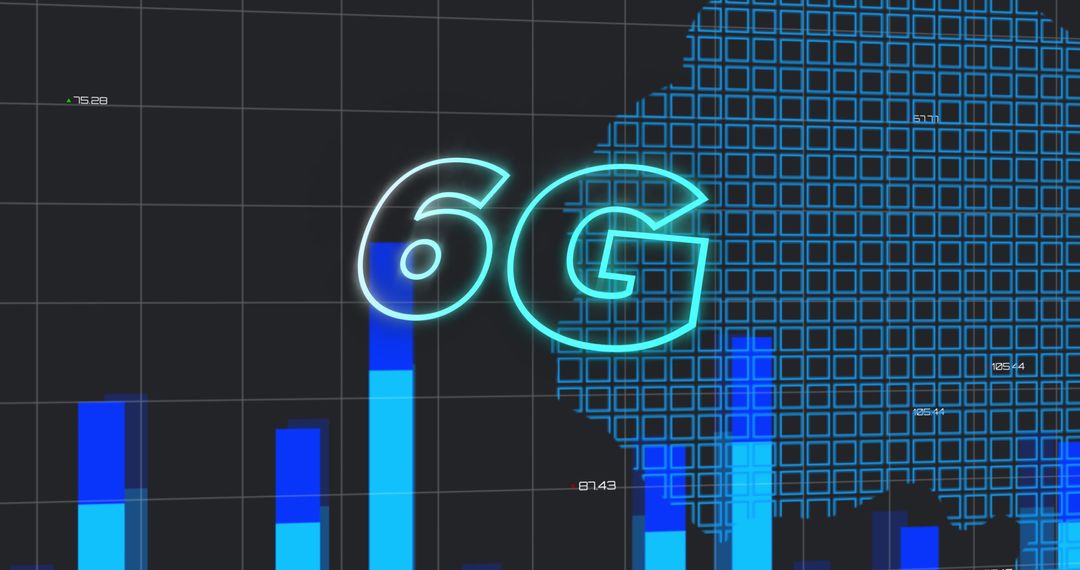
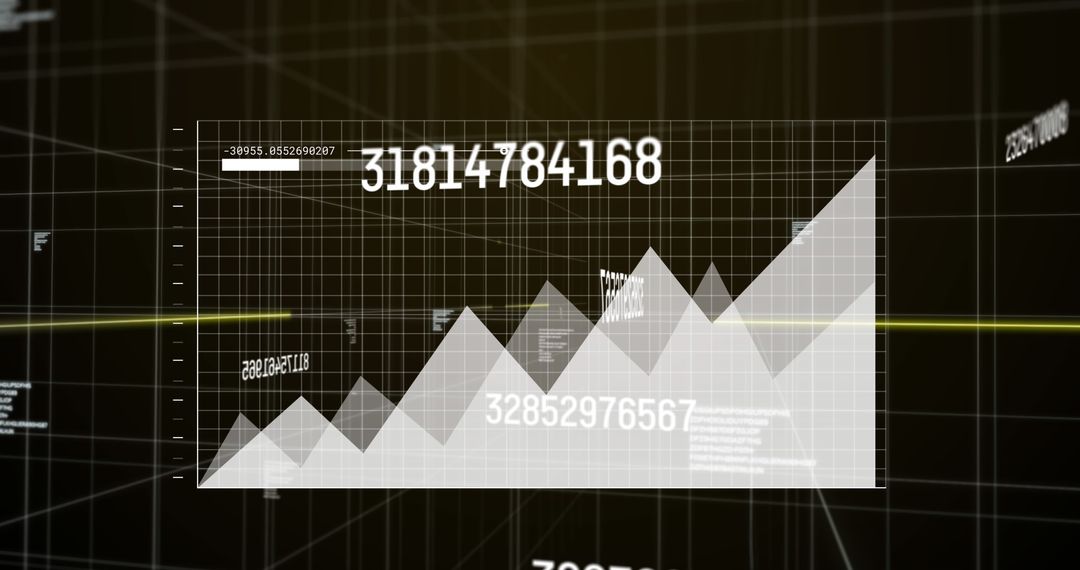
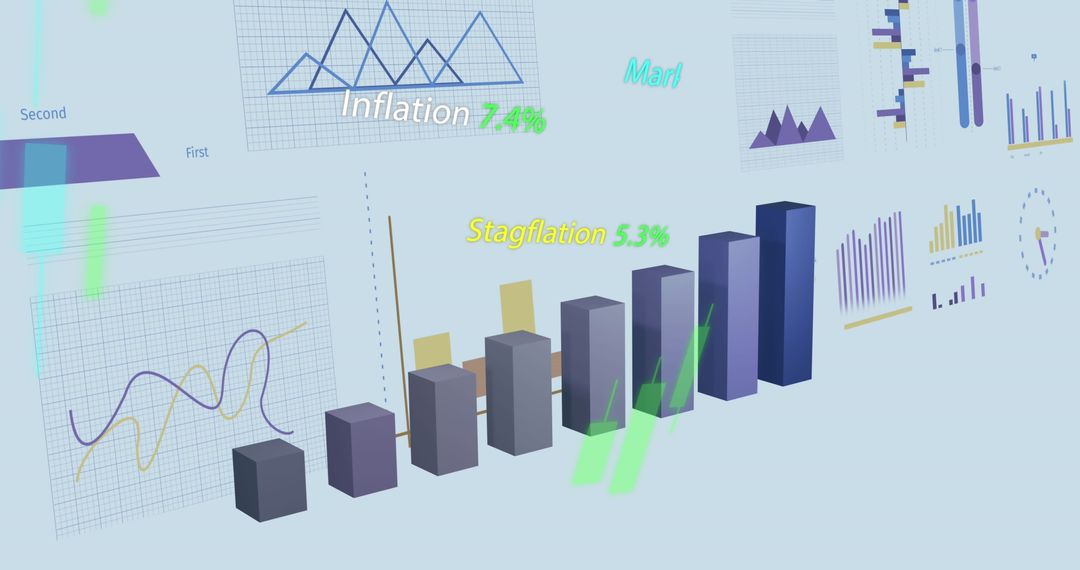
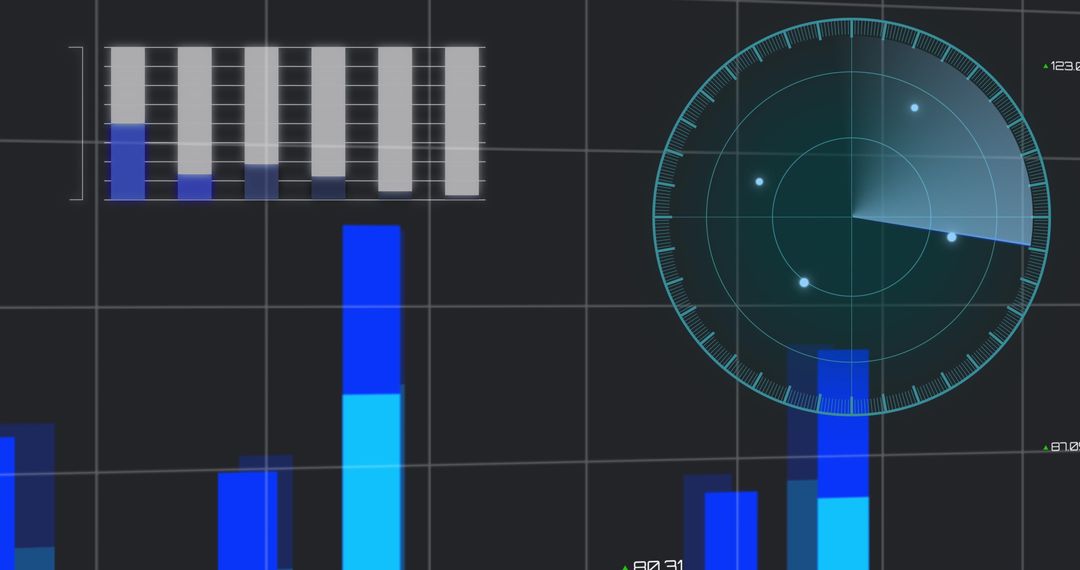
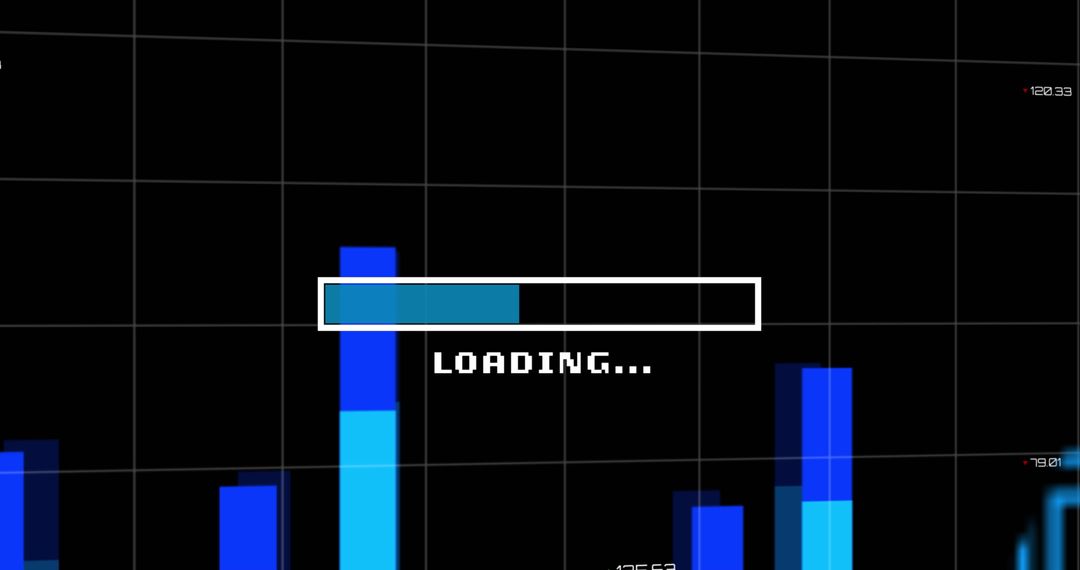
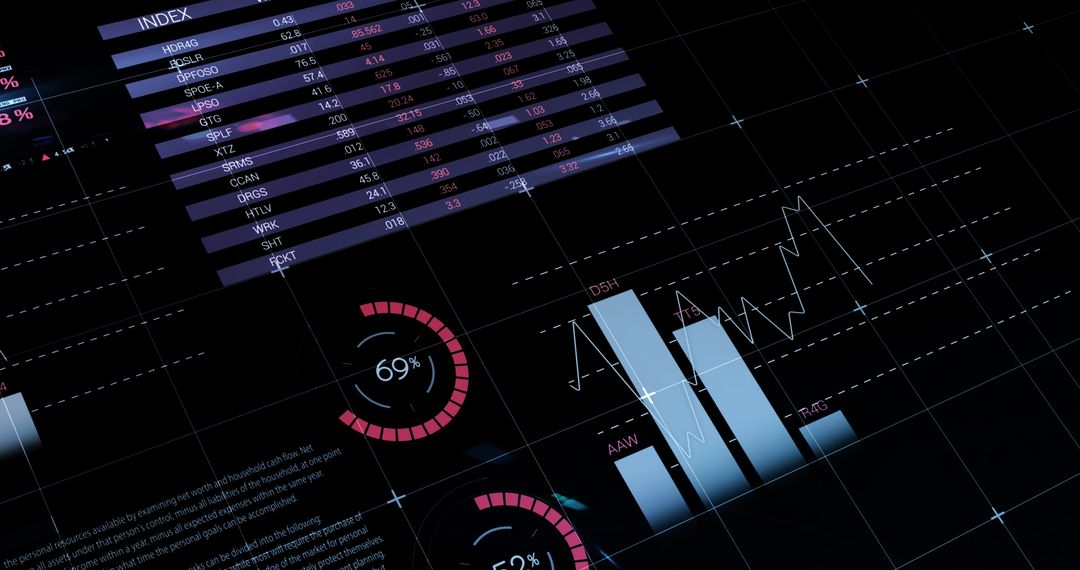
- Digital Bar Graph with British Pound Symbol on Screen
Digital Bar Graph with British Pound Symbol on Screen Image
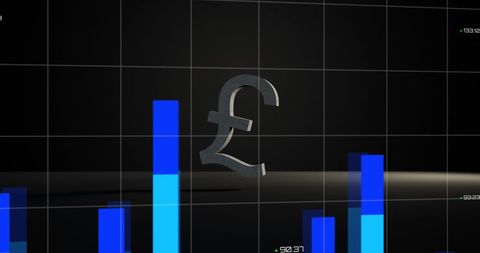
An image depicting a digital bar graph featuring varied blue shades with a prominent British pound symbol. Set against a black background, it emphasizes the concepts of finance and digital data analysis, making it suitable for use in economic or financial reports, presentations, and online articles relating to global business challenges and analytics.
Powered by 


2
downloads
downloads
Tags:
More
Credit Photo
If you would like to credit the Photo, here are some ways you can do so
Text Link
photo Link
<span class="text-link">
<span>
<a target="_blank" href=https://pikwizard.com/photo/digital-bar-graph-with-british-pound-symbol-on-screen/dd427d8071f83b0147888a7700b85678/>PikWizard</a>
</span>
</span>
<span class="image-link">
<span
style="margin: 0 0 20px 0; display: inline-block; vertical-align: middle; width: 100%;"
>
<a
target="_blank"
href="https://pikwizard.com/photo/digital-bar-graph-with-british-pound-symbol-on-screen/dd427d8071f83b0147888a7700b85678/"
style="text-decoration: none; font-size: 10px; margin: 0;"
>
<img src="https://pikwizard.com/pw/medium/dd427d8071f83b0147888a7700b85678.jpg" style="margin: 0; width: 100%;" alt="" />
<p style="font-size: 12px; margin: 0;">PikWizard</p>
</a>
</span>
</span>
Free (free of charge)
Free for personal and commercial use.
Author: Awesome Content
Similar Free Stock Images

Premium


Premium


Premium


Premium


Premium


Premium


Premium


Premium


Premium


Premium


Premium


Premium


Premium


Premium


Premium


Premium


Premium


Premium


Premium


Premium

Premium


Premium


Premium


Premium