
- Home >
- Stock Photos >
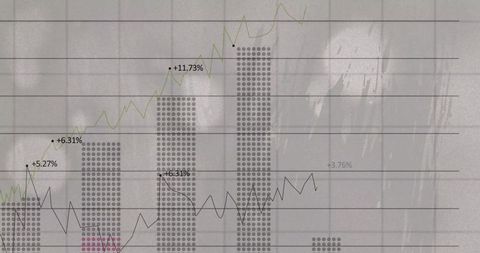
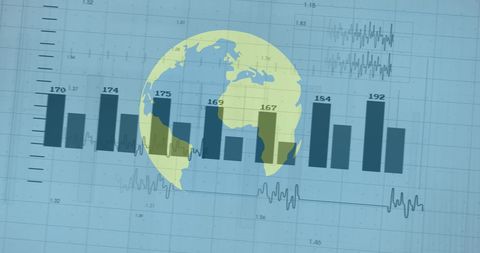
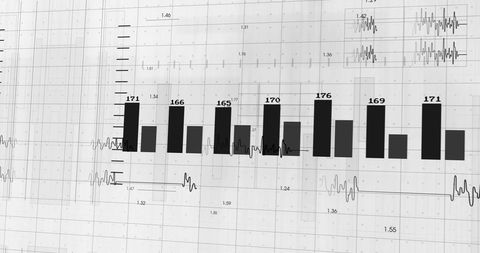
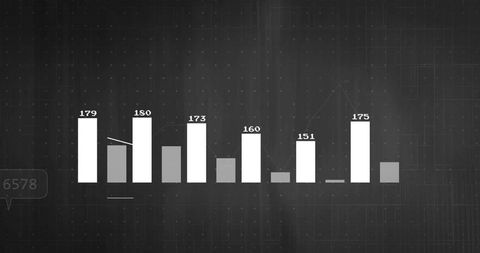
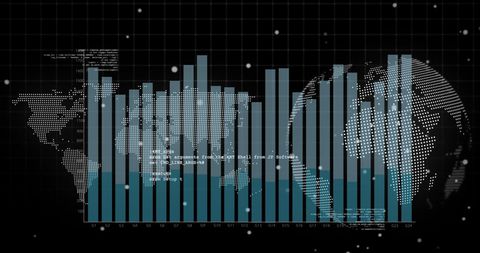
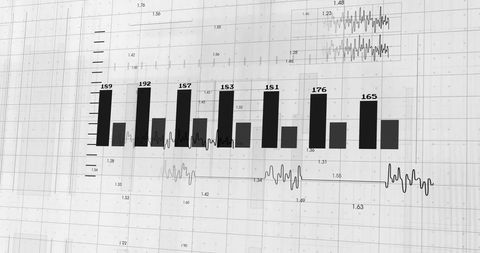
- Digital Bar Graph With Data Overlay on White Background
Digital Bar Graph With Data Overlay on White Background Image
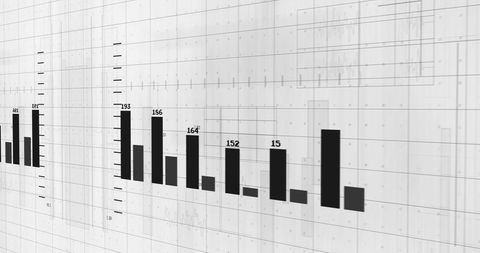
Visually striking bar graph displays data dynamically on a white background, making it ideal for presentations in business and finance environments. Useful for representing analytics, global business trends, and statistical information in reports and digital content.
Powered by 


downloads
Tags:
More
Credit Photo
If you would like to credit the Photo, here are some ways you can do so
Text Link
photo Link
<span class="text-link">
<span>
<a target="_blank" href=https://pikwizard.com/photo/digital-bar-graph-with-data-overlay-on-white-background/81bc96ade9134dd5932a5fa4f35abed4/>PikWizard</a>
</span>
</span>
<span class="image-link">
<span
style="margin: 0 0 20px 0; display: inline-block; vertical-align: middle; width: 100%;"
>
<a
target="_blank"
href="https://pikwizard.com/photo/digital-bar-graph-with-data-overlay-on-white-background/81bc96ade9134dd5932a5fa4f35abed4/"
style="text-decoration: none; font-size: 10px; margin: 0;"
>
<img src="https://pikwizard.com/pw/medium/81bc96ade9134dd5932a5fa4f35abed4.jpg" style="margin: 0; width: 100%;" alt="" />
<p style="font-size: 12px; margin: 0;">PikWizard</p>
</a>
</span>
</span>
Free (free of charge)
Free for personal and commercial use.
Author: Authentic Images
Similar Free Stock Images

Premium


Premium

Premium


Premium


Premium


Premium


Premium


Premium


Premium

Premium

Premium


Premium


Premium


Premium


Premium


Premium


Premium


Premium


Premium


Premium


Premium


Premium


Premium


Premium

Premium


Explore More Free Stock Images