
- Home >
- Stock Photos >
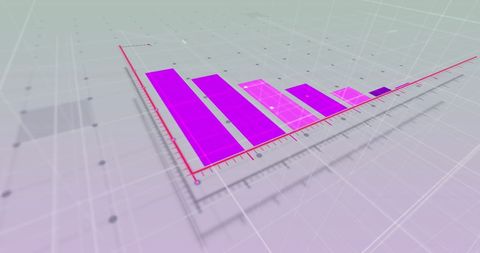
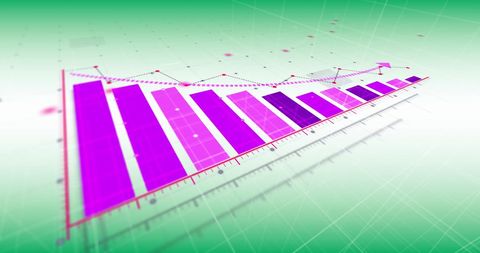
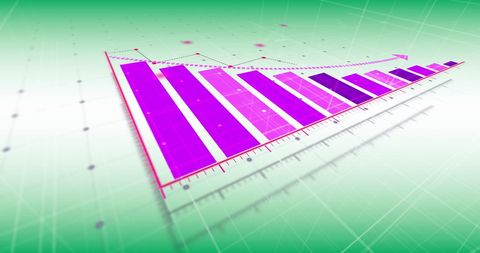
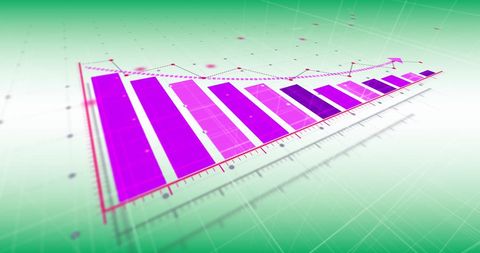
- Digital Bar Graph with Declining Data Points on Green Background
Digital Bar Graph with Declining Data Points on Green Background Image

Bar graph with red shades indicating declining trend across data points. Perfect for presenting analytics or highlighting decreases in data. Could be used in business reports or economic discussions to illustrate declining trends or negative performance indicators.
Powered by  - Get 15% off with code: PIKWIZARD15


downloads
Tags:
More
Credit Photo
If you would like to credit the Photo, here are some ways you can do so
Text Link
photo Link
<span class="text-link">
<span>
<a target="_blank" href=https://pikwizard.com/photo/digital-bar-graph-with-declining-data-points-on-green-background/dd8abfd742a5dca69fd6935a283b1cc8/>PikWizard</a>
</span>
</span>
<span class="image-link">
<span
style="margin: 0 0 20px 0; display: inline-block; vertical-align: middle; width: 100%;"
>
<a
target="_blank"
href="https://pikwizard.com/photo/digital-bar-graph-with-declining-data-points-on-green-background/dd8abfd742a5dca69fd6935a283b1cc8/"
style="text-decoration: none; font-size: 10px; margin: 0;"
>
<img src="https://pikwizard.com/pw/medium/dd8abfd742a5dca69fd6935a283b1cc8.jpg" style="margin: 0; width: 100%;" alt="" />
<p style="font-size: 12px; margin: 0;">PikWizard</p>
</a>
</span>
</span>
Free (free of charge)
Free for personal and commercial use.
Author: People Creations
Similar Free Stock Images

Premium


Premium

Premium


Premium


Premium


Premium

Premium

Premium


Premium


Premium

Premium

Premium


Premium


Premium


Premium


Premium


Premium


Premium


Premium


Premium


Premium

Premium


Premium

Premium

Premium


Explore More Free Stock Images