- Home >
- Stock Photos >
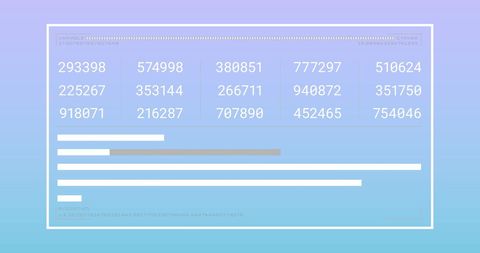
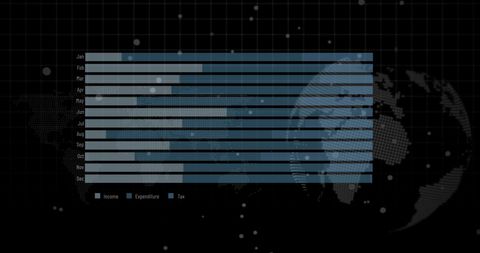
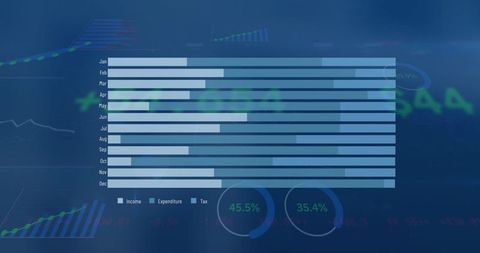
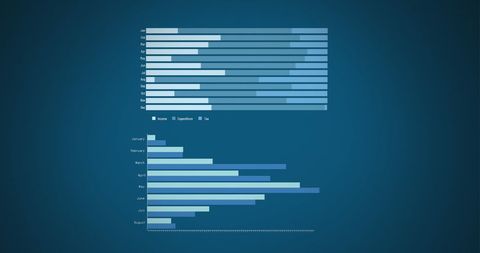
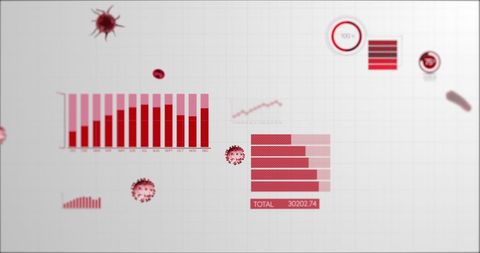
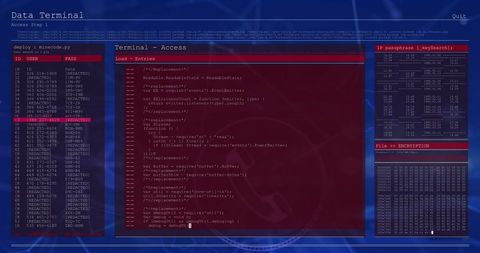
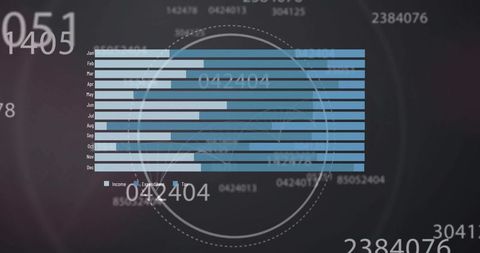
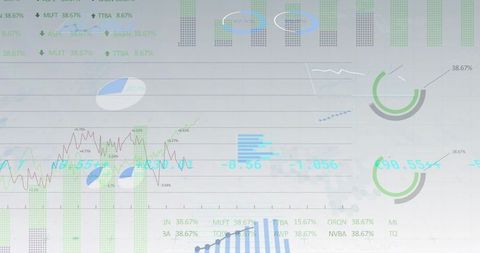
- Digital Bar Graphs Display Finance Data Online
Digital Bar Graphs Display Finance Data Online Image
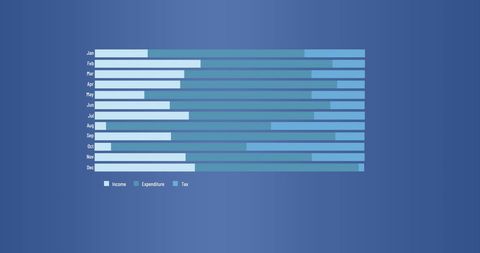
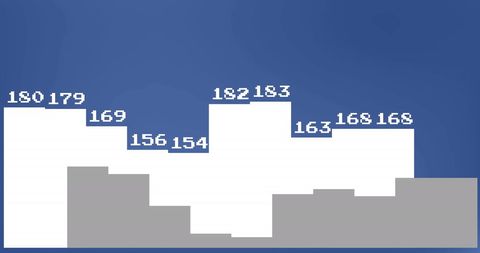
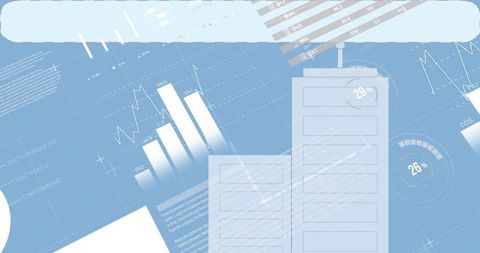
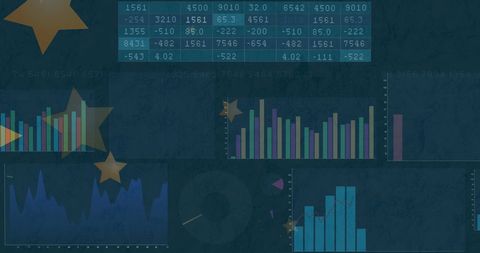
Horizontal bar graphs in digital style show various financial data across months, suggesting financial analysis or budgeting. Ideal for presentations on finance management, business analytics, or reports on economic trends. The blue tone conveys professionalism and technological advancement.

downloads
Tags:
More
Credit Photo
If you would like to credit the Photo, here are some ways you can do so
Text Link
photo Link
<span class="text-link">
<span>
<a target="_blank" href=https://pikwizard.com/photo/digital-bar-graphs-display-finance-data-online/6b00f7ea3009fdb41dca7a16cc7b54ba/>PikWizard</a>
</span>
</span>
<span class="image-link">
<span
style="margin: 0 0 20px 0; display: inline-block; vertical-align: middle; width: 100%;"
>
<a
target="_blank"
href="https://pikwizard.com/photo/digital-bar-graphs-display-finance-data-online/6b00f7ea3009fdb41dca7a16cc7b54ba/"
style="text-decoration: none; font-size: 10px; margin: 0;"
>
<img src="https://pikwizard.com/pw/medium/6b00f7ea3009fdb41dca7a16cc7b54ba.jpg" style="margin: 0; width: 100%;" alt="" />
<p style="font-size: 12px; margin: 0;">PikWizard</p>
</a>
</span>
</span>
Free (free of charge)
Free for personal and commercial use.
Author: People Creations