- Home >
- Stock Photos >
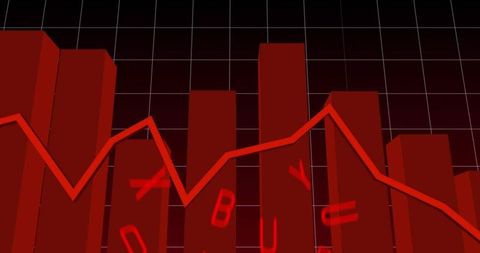
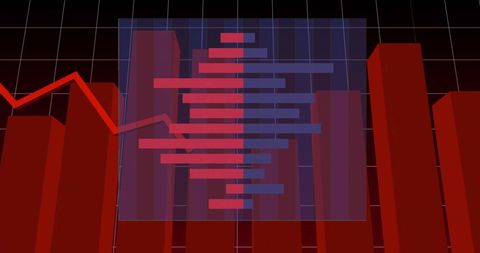
- Digital Bear Market Symbol with Red Financial Graph
Digital Bear Market Symbol with Red Financial Graph Image

Stylized geometric bear design overlays financial data against a red-toned background. Symbolizes bearish market trends and economic downturn. Useful for illustrating financial articles, investment guides, or economic analysis topics.
Powered by 


2
downloads
downloads
Tags:
More
Credit Photo
If you would like to credit the Photo, here are some ways you can do so
Text Link
photo Link
<span class="text-link">
<span>
<a target="_blank" href=https://pikwizard.com/photo/digital-bear-market-symbol-with-red-financial-graph/769e822891369d2927c74e1c4a7c4b42/>PikWizard</a>
</span>
</span>
<span class="image-link">
<span
style="margin: 0 0 20px 0; display: inline-block; vertical-align: middle; width: 100%;"
>
<a
target="_blank"
href="https://pikwizard.com/photo/digital-bear-market-symbol-with-red-financial-graph/769e822891369d2927c74e1c4a7c4b42/"
style="text-decoration: none; font-size: 10px; margin: 0;"
>
<img src="https://pikwizard.com/pw/medium/769e822891369d2927c74e1c4a7c4b42.jpg" style="margin: 0; width: 100%;" alt="" />
<p style="font-size: 12px; margin: 0;">PikWizard</p>
</a>
</span>
</span>
Free (free of charge)
Free for personal and commercial use.
Author: People Creations
Similar Free Stock Images

Premium


Premium


Premium


Premium


Premium


Premium


Premium


Premium


Premium


Premium


Premium


Premium


Premium


Premium


Premium


Premium


Premium


Premium


Premium


Premium


Premium


Premium


Premium


Premium


Premium