
- Home >
- Stock Photos >
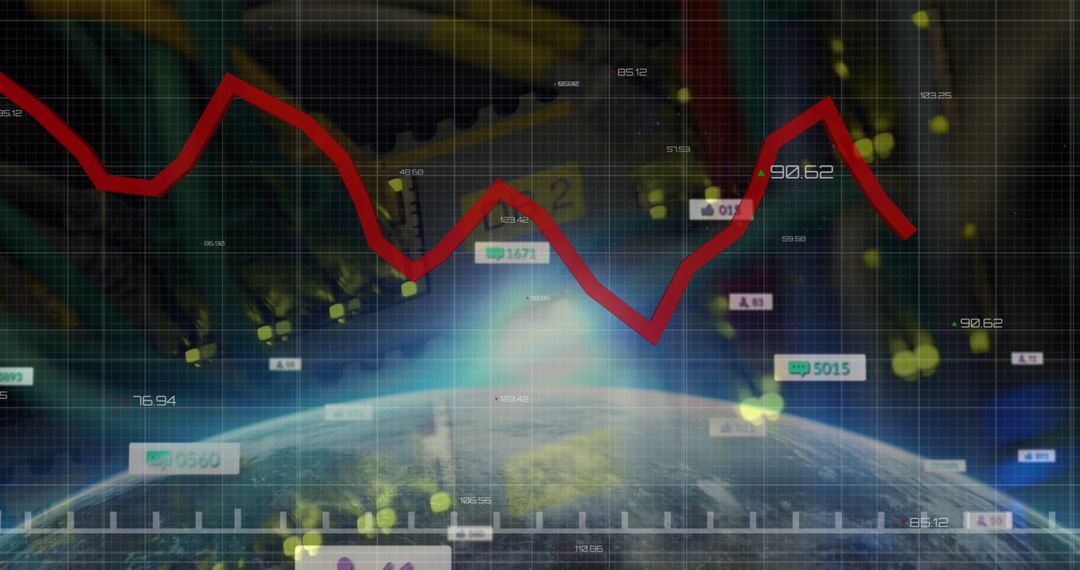
- Digital Business and Technology Abstract with Declining Growth
Digital Business and Technology Abstract with Declining Growth Image

Combining elements of server rooms and global digital data processing, this abstract representation is ideal for conceptual topics related to financial technology, analytics, and environmental impact on digital growth. Incorporating strong visual cues with a declining red graph, it highlights themes of economic changes, suitable for use in presentations related to financial uncertainties or digital strategy shifts.
Powered by  - Get 15% off with code: PIKWIZARD15


4
downloads
downloads
Tags:
More
Credit Photo
If you would like to credit the Photo, here are some ways you can do so
Text Link
photo Link
<span class="text-link">
<span>
<a target="_blank" href=https://pikwizard.com/photo/digital-business-and-technology-abstract-with-declining-growth/8d29004a98b5528a1d611e2ba8bce665/>PikWizard</a>
</span>
</span>
<span class="image-link">
<span
style="margin: 0 0 20px 0; display: inline-block; vertical-align: middle; width: 100%;"
>
<a
target="_blank"
href="https://pikwizard.com/photo/digital-business-and-technology-abstract-with-declining-growth/8d29004a98b5528a1d611e2ba8bce665/"
style="text-decoration: none; font-size: 10px; margin: 0;"
>
<img src="https://pikwizard.com/pw/medium/8d29004a98b5528a1d611e2ba8bce665.jpg" style="margin: 0; width: 100%;" alt="" />
<p style="font-size: 12px; margin: 0;">PikWizard</p>
</a>
</span>
</span>
Free (free of charge)
Free for personal and commercial use.
Author: People Creations
Similar Free Stock Images

Premium


Premium


Premium


Premium


Premium


Premium


Premium


Premium


Premium


Premium


Premium


Premium


Premium


Premium


Premium


Premium


Premium


Premium


Premium


Premium


Premium


Premium


Premium


Premium

