- Home >
- Stock Photos >
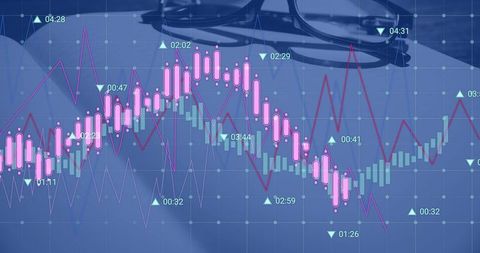
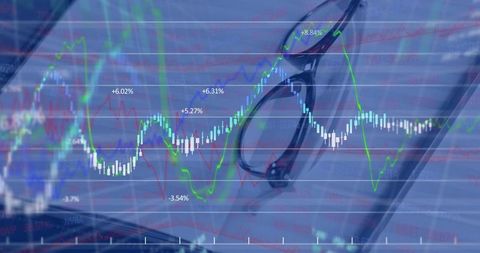
- Digital Candlestick Chart Analysis Foreground Desk Workspace
Digital Candlestick Chart Analysis Foreground Desk Workspace Image
Modern financial graph digitally overlaying a wooden desk signifies innovation in investment analysis. Utilizing elements such as candlestick patterns and line measurements, it provides immediate financial insight attractive to data-driven businesses. Practical visual for conveyance in stock market reports, fintech websites, and insightful financial seminars. Adds a polished perspective to presentations discussing businesses finances, evolving market tactics, or technology's impact on stock trading.

downloads
Tags:
More
Credit Photo
If you would like to credit the Photo, here are some ways you can do so
Text Link
photo Link
<span class="text-link">
<span>
<a target="_blank" href=https://pikwizard.com/photo/digital-candlestick-chart-analysis-foreground-desk-workspace/c685acd914a01fefab2e0033c9275e04/>PikWizard</a>
</span>
</span>
<span class="image-link">
<span
style="margin: 0 0 20px 0; display: inline-block; vertical-align: middle; width: 100%;"
>
<a
target="_blank"
href="https://pikwizard.com/photo/digital-candlestick-chart-analysis-foreground-desk-workspace/c685acd914a01fefab2e0033c9275e04/"
style="text-decoration: none; font-size: 10px; margin: 0;"
>
<img src="https://pikwizard.com/pw/medium/c685acd914a01fefab2e0033c9275e04.jpg" style="margin: 0; width: 100%;" alt="" />
<p style="font-size: 12px; margin: 0;">PikWizard</p>
</a>
</span>
</span>
Free (free of charge)
Free for personal and commercial use.
Author: Authentic Images