- Home >
- Stock Photos >
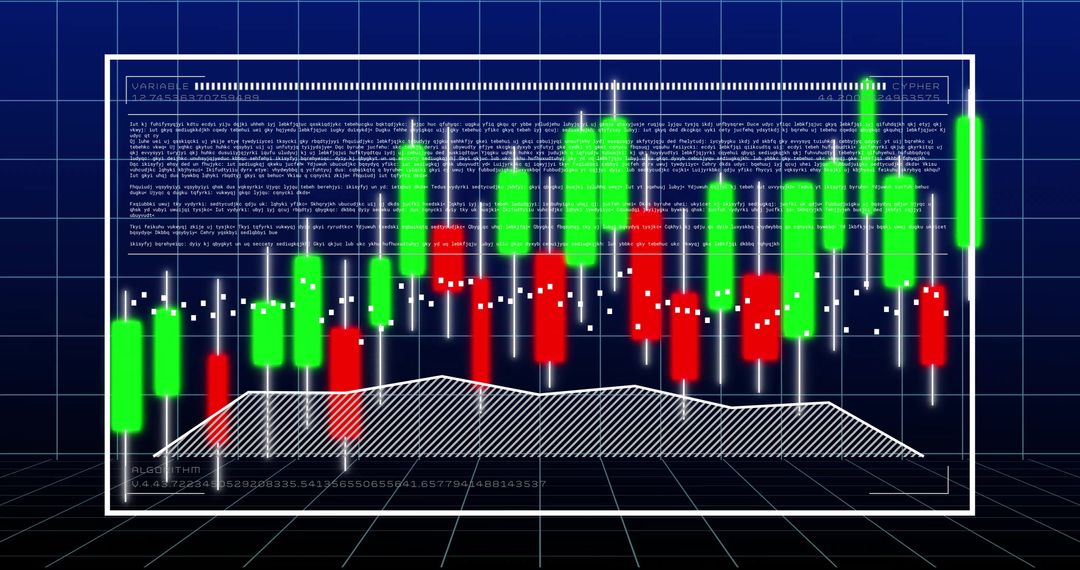
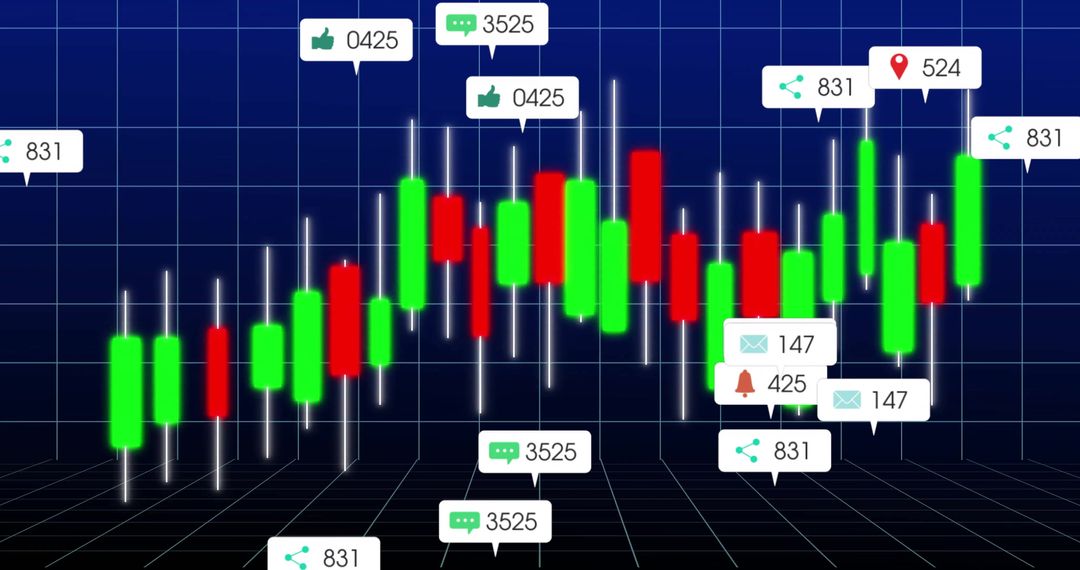
- Digital Candlestick Chart on Virtual Grid in Blue Tone
Digital Candlestick Chart on Virtual Grid in Blue Tone Image

This illustration features digital candlestick bars overlaid on a blue virtual grid, illustrating stock market trends. The visual elements like numbers add an analytic touch, making it ideal for use in financial, investment, or trading contexts. It suits presentations on financial analytics, reports on market trends, or digital interfaces in economic apps.
Powered by 


0
downloads
downloads
Tags:
More
Credit Photo
If you would like to credit the Photo, here are some ways you can do so
Text Link
photo Link
<span class="text-link">
<span>
<a target="_blank" href=https://pikwizard.com/photo/digital-candlestick-chart-on-virtual-grid-in-blue-tone/77dc6acdcfcf4d4b6de270fe80e6f8c2/>PikWizard</a>
</span>
</span>
<span class="image-link">
<span
style="margin: 0 0 20px 0; display: inline-block; vertical-align: middle; width: 100%;"
>
<a
target="_blank"
href="https://pikwizard.com/photo/digital-candlestick-chart-on-virtual-grid-in-blue-tone/77dc6acdcfcf4d4b6de270fe80e6f8c2/"
style="text-decoration: none; font-size: 10px; margin: 0;"
>
<img src="https://pikwizard.com/pw/medium/77dc6acdcfcf4d4b6de270fe80e6f8c2.jpg" style="margin: 0; width: 100%;" alt="" />
<p style="font-size: 12px; margin: 0;">PikWizard</p>
</a>
</span>
</span>
Free (free of charge)
Free for personal and commercial use.
Author: Awesome Content
Similar Free Stock Images

Premium


Premium


Premium


Premium


Premium


Premium


Premium


Premium


Premium


Premium


Premium


Premium


Premium


Premium


Premium


Premium


Premium


Premium


Premium


Premium


Premium


Premium


Premium


Premium