- Home >
- Stock Photos >
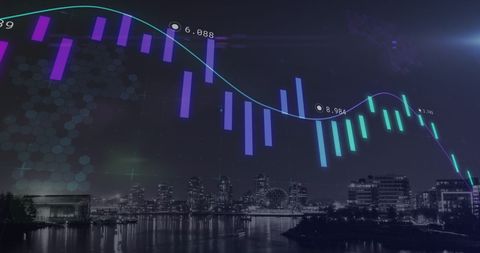
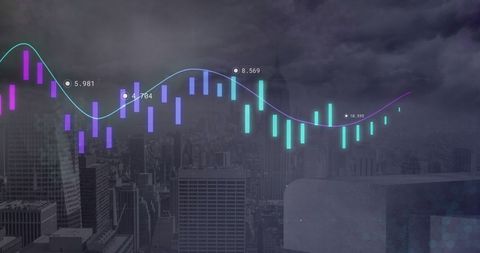
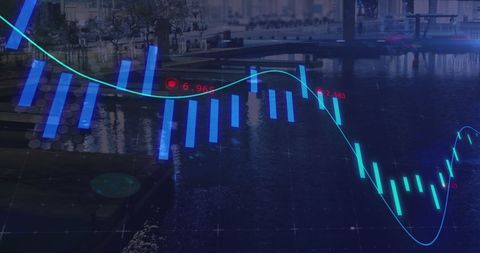
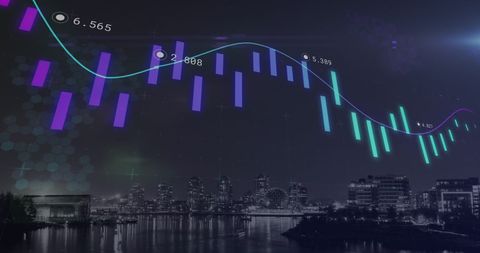
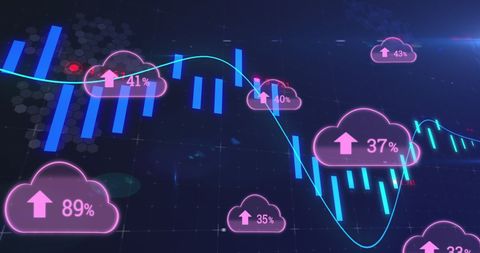
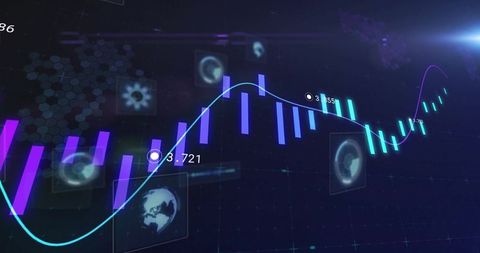
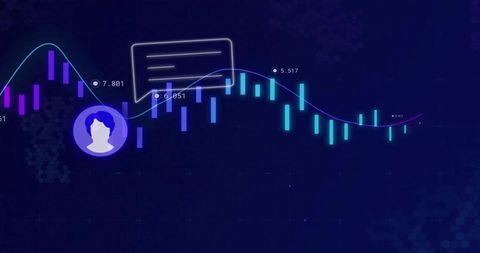
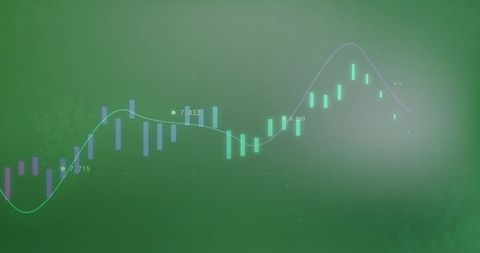
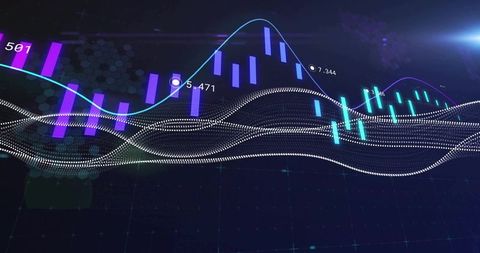
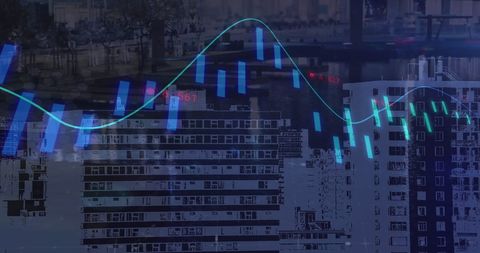
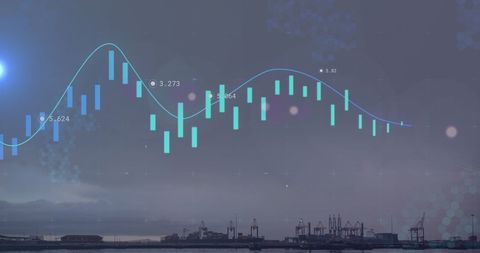
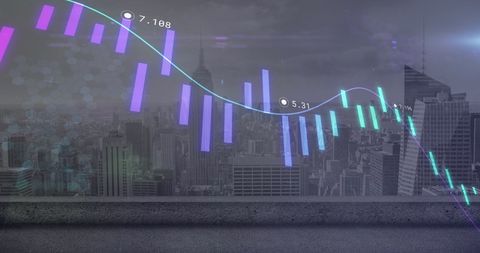
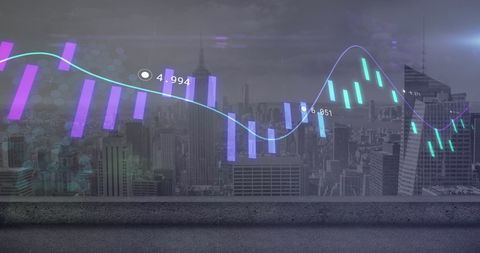
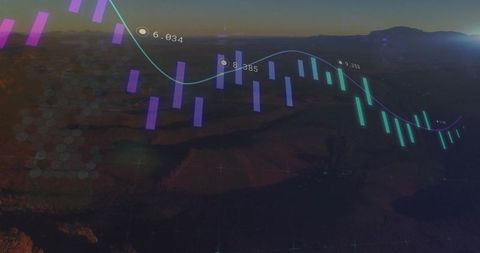
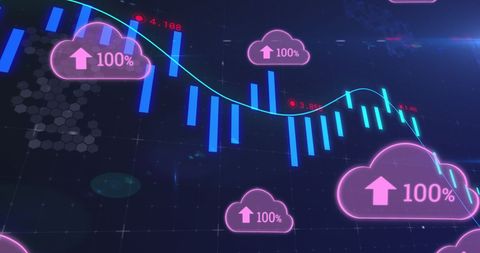
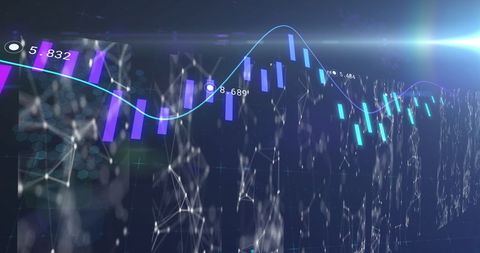
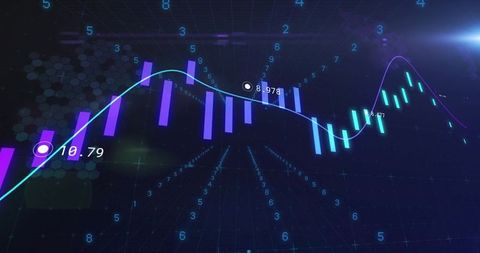
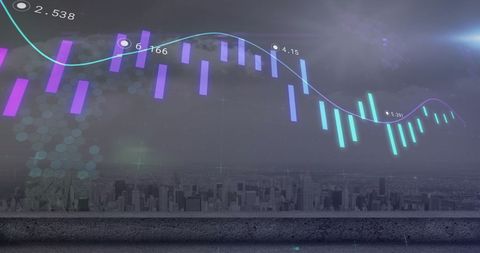
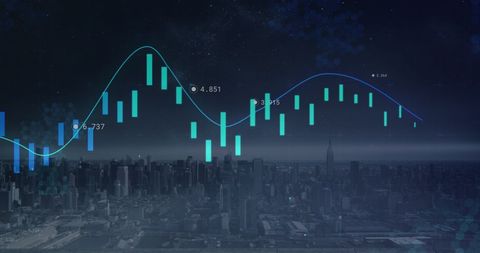
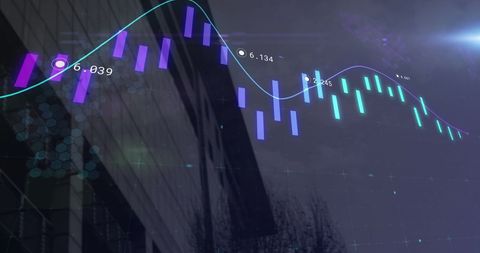
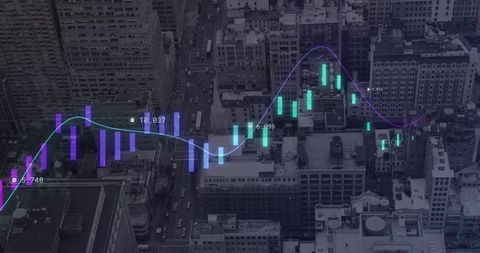
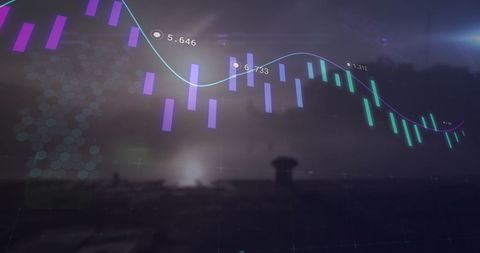
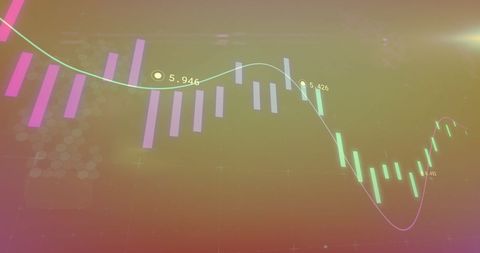
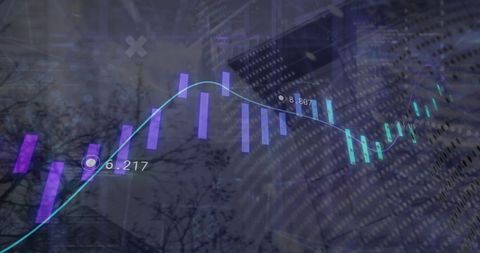
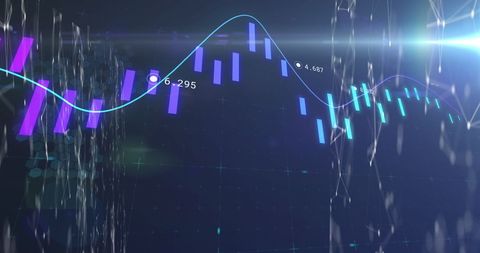
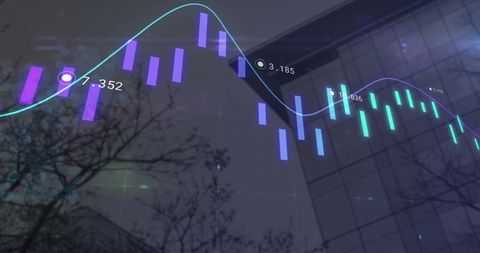
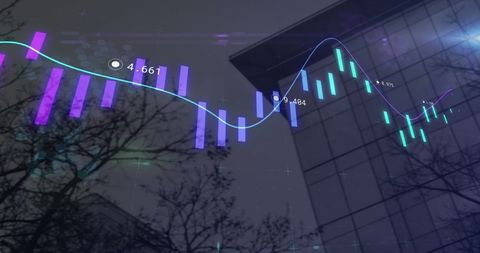
- Digital Candlestick Chart Visualization on Futuristic Dashboard
Digital Candlestick Chart Visualization on Futuristic Dashboard Image

This visualization features colorful candlestick bars alongside a line graph on a futuristic digital dashboard. The setup is indicative of financial market analysis, highlighting trends, price movements, and data analytics. The grid lines and numeric labels add a sophisticated, realistic touch to the scene, catering well to technological or financial publication. This can be used for presentations about finance, trading strategies, or advanced data visualization, offering both visual appeal and clear preventive insights.

downloads
Tags:
More
Credit Photo
If you would like to credit the Photo, here are some ways you can do so
Text Link
photo Link
<span class="text-link">
<span>
<a target="_blank" href=https://pikwizard.com/photo/digital-candlestick-chart-visualization-on-futuristic-dashboard/86401a040bb5b1760f368229947f8920/>PikWizard</a>
</span>
</span>
<span class="image-link">
<span
style="margin: 0 0 20px 0; display: inline-block; vertical-align: middle; width: 100%;"
>
<a
target="_blank"
href="https://pikwizard.com/photo/digital-candlestick-chart-visualization-on-futuristic-dashboard/86401a040bb5b1760f368229947f8920/"
style="text-decoration: none; font-size: 10px; margin: 0;"
>
<img src="https://pikwizard.com/pw/medium/86401a040bb5b1760f368229947f8920.jpg" style="margin: 0; width: 100%;" alt="" />
<p style="font-size: 12px; margin: 0;">PikWizard</p>
</a>
</span>
</span>
Free (free of charge)
Free for personal and commercial use.
Author: People Creations