
- Home >
- Stock Photos >
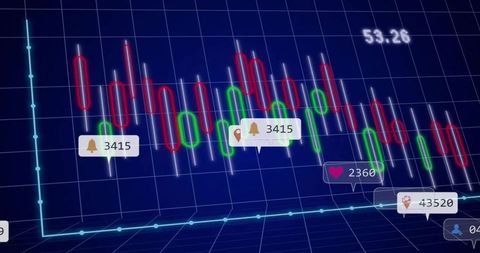
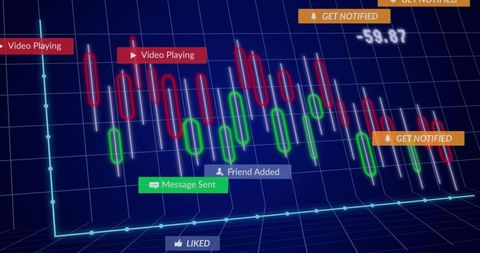
- Digital Candlestick Chart with Social Interaction Icons for Analytics
Digital Candlestick Chart with Social Interaction Icons for Analytics Image
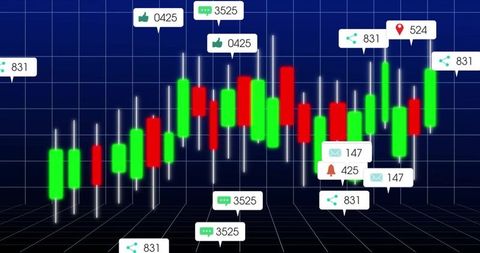
This image showcases a 3D floating candlestick chart set against a digital grid backdrop, featuring green and red bars that indicate market trends. The addition of social media interaction icons illustrates the convergence of real-time data analytics and social engagement in modern financial trading. Ideal for use in presentations or articles related to fintech, investments, stock trading, online analytics, or financial app interface designs.
Powered by  - Get 15% off with code: PIKWIZARD15


downloads
Tags:
More
Credit Photo
If you would like to credit the Photo, here are some ways you can do so
Text Link
photo Link
<span class="text-link">
<span>
<a target="_blank" href=https://pikwizard.com/photo/digital-candlestick-chart-with-social-interaction-icons-for-analytics/5652286539d67dc2c8983df0b0dec2f5/>PikWizard</a>
</span>
</span>
<span class="image-link">
<span
style="margin: 0 0 20px 0; display: inline-block; vertical-align: middle; width: 100%;"
>
<a
target="_blank"
href="https://pikwizard.com/photo/digital-candlestick-chart-with-social-interaction-icons-for-analytics/5652286539d67dc2c8983df0b0dec2f5/"
style="text-decoration: none; font-size: 10px; margin: 0;"
>
<img src="https://pikwizard.com/pw/medium/5652286539d67dc2c8983df0b0dec2f5.jpg" style="margin: 0; width: 100%;" alt="" />
<p style="font-size: 12px; margin: 0;">PikWizard</p>
</a>
</span>
</span>
Free (free of charge)
Free for personal and commercial use.
Author: Creative Art
Similar Free Stock Images

Premium


Premium

Premium


Premium


Premium

AI


Premium


Premium


Premium


Premium


Premium


Premium


Premium


Premium

Premium


Premium


Premium


Premium


Premium

Premium


Premium


Premium


Premium


Premium


Premium


Premium

Explore More Free Stock Images