1. Home > 
  2. Stock Photos > 
  3. Digital Chart Display Financial Data Analysis Background Effects

Digital Chart Display Financial Data Analysis Background Effects Image

Digital Chart Display Financial Data Analysis Background Effects

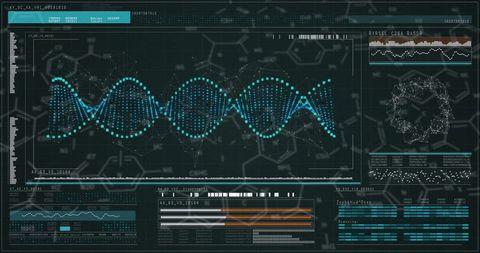
Graphical interface features financial data with charts and percentages on navy background. Useful for illustrating concepts of global finance, investment strategy, data analysis, and economic trends in presentations or publications.

Powered by Adobe logo
A close-up of a digital screen displaying various data charts, graphs, and analytics in a modern office environment. - Powered by Adobe
Dynamic blue and green digital stock market graph with bar charts and lines on a dark background, representing financial data analysis, investment trends, business growth, and global economy fluctuat - Powered by AdobeTrade business analytics graph and financial chart investment. Stock market investment trading graph and crypto currency.	
 - Powered by AdobeAnalyzing financial data on a smartphone, with charts and graphs in the background - Powered by AdobeAnalyzing real-time financial market trends and stock performance with vibrant candlestick charts and data displayed on a digital screen, symbolizing investment analysis and global economic activity - Powered by Adobe

Credit Photo

If you would like to credit the Photo, here are some ways you can do so

Free (free of charge)

Free for personal and commercial use.

Author: Creative Art

Similar Free Stock Images

Digital Financial Data Analysis with Infographics and Charts
Premium
Healthcare business graph data and growth of investment, Medical report, The recent pandemic has increased people's interest in healthcare, leading to continued growth in the hospital business.
Dynamic Financial Data Chart Display with Graphical Analysis
Data Visualization on Security Shield Interface for Cyber Security
Digital Data Visualization with Trend Lines and Percentage Changes
Dynamic Stock Market Graphs Indicating Financial Trends
Premium
Financial Growth Visualization: An upward trending arrow symbolizes growth amidst a backdrop of blurred financial charts. The image encapsulates the essence of financial progress.
Futuristic Digital Interface with Spiraling Coding Patterns
Data Analytics Graphs on Digital Interface Background
Rising Financial Data Graph on Digital Grid Background
Dynamic Financial Data Chart Showing Trend Analysis
Financial Growth Chart with Data Visualization Elements
Premium
Futuristic financial data visualization with glowing blue line graphs and vertical bar chart, Abstract financial chart with rising graphs
Holographic Financial Stock Market Analysis Visualization
Financial Data Analysis with Interactive Graphs
Financial Data Graph Rendering Global Market Trends
Dynamic Financial Graphs Illustrating Market Trends
Fluctuating Digital Stock Market Data Chart
Premium
A water droplet resting on a surface of flowing charts
Abstract Digital Charts with Social Media Metrics Rising
NFT Financial Data Visualization with Digital Graph Overlay
Financial Stock Market Data Analysis on Digital Interface
Dynamic Financial Data Display in Digital Space
Premium
Shattered financial graphs
Digital Data Visualization and Analysis Interface
Dynamic Financial Charts and Graphs Indicating Market Trends
Digital Financial Data Processing Interface on Red Background
Financial Data Flow against Urban Skyline Backdrop
Premium
Classical architectural structure with digital stock market data overlay in blue tones. Neoclassical columns and building facade merging with financial graphs and trading analytics
Futuristic Digital DNA Interface with Waveform Data Visualization
Analyzing Data Trends on Digital Graph Interface
Fluctuating Stock Market Graph with Dramatic Peaks
Dynamic Financial Data Visualization on Digital Grid Background
Premium
Tablet displaying financial data graphs on a dark control panel
Futuristic Neon Green Data Visualization on Grid Background
Premium
Data Examination: A magnifying glass hovers over financial reports and charts on a sky-blue surface, providing an overview of the business analysis.
Digital Cityscape with Financial Data Overlay
Dynamic Stock Market Analysis Concept Artwork
Dynamic Financial Graphs Overlaying Modern Cityscape
Dynamic Financial Graphs and Data Analysis Interface
Premium
A large group of people observing a complex data visualization of financial trends
Advanced Digital Dashboard with Rising Bar and Line Charts
Dynamic Data Visualization and Financial Growth Curves
Abstract Financial Data Processing and Analysis Interface
Financial Graph with Data Analysis and Market Statistics
Premium
An analyst uses a computer and dashboard for data business analysis and Data Management System with KPI and metrics connected to the database for technology finance, operations, sales, marketing
Dynamic Financial Data Against Urban Skyline
Colorful Data Visualization Graphs on Digital Grid
Dynamic Red Line Graph With Data Points on Gridded Background
Financial Data Processing with Rising Graphs
Premium
Blurred industrial landscape overlaid with financial data
Rising Stock Market Trends and Chart Analysis
Dynamic Digital Data Analysis on Elevated Grid
Dynamic Data Visualization with Financial Charts and 3D Elements
Rising Digital Graph and Data Visualizations on Black Background
Premium
American flag waving over financial data
Digital Security In Financial Analytics Showing Data Chart and Padlock
Digital Data Flow with Infographics Hologram
Economic and Political Factors Influence Investment Trends
Digital Financial Data Analysis with Graphs and Stock Market Trends
Premium
Team working with graphs and data on laptops and tablets at office table
Digital DNA Strand Visualization on Modern Interface Background
Dynamic Business Data and Cityscape Visualization
Financial Data Charts with World Map on Blue Digital Background
Dynamic Stock Market Chart with Fluctuating Trends and Data Points
Fluctuating Financial Graph on Green Grid Background
Digital Financial Data with Graph and Grid Patterns
Digital Finance: Modern Stock Market Analysis Display
Digital Stock Market Trends and Financial Growth Analysis
Premium
Hands analyzing financial data with magnifying glass showing upward trend from 2022 to 2026 on glowing chart in futuristic business concept.
Futuristic Digital Console with Graphs and Data Visualizations
Futuristic Data Visualization with Dynamic Graphs and Digital Globe
Candlestick Chart Visualization with Indicators and Growth Highlight
Premium
Stethoscope on glowing digital financial display with pink, blue hues. Shows market analysis, stock data, economy trends, business investment graphs. Futuristic interface with bright abstract
Dynamic Financial Data Graphs Networking in Global Business
Rising Graphs and Interactive Financial Data Analytics Background
Rising Graph Line on Digital Green Grid Background
Data Analytics and Financial Growth Indicators
Premium
Interactive Data Analysis and Forecasting. Business and finance concept.
Financial Analytics Dashboard with Dynamic Charts and Script Display
Digital Interface Visualizing DNA and Data Patterns
Financial Data Line Graph on Digital Display
Dynamic Stock Market Graphs Over Digital Interface
Dynamic Financial Stock Market Analysis Display
Holographic Financial Data Visualization with Stock Trends
Digital Visualization of Global Networking with Statistical Graphs
Abstract Data Visualization with Dynamic Charts and Graphs
European Market Data Overlay with EU Flag and Financial Graphs
Premium
Focused businesswoman analyzing financial graphs on dual screens
Financial Growth Graph and Data Analytics Representation
Abstract Digital Finance Chart Showing Fluctuating Graph Lines
Global Analytics Dashboard with Zigzag Chart on Dark Interface
Futuristic Graph and Data Visualization Interface Design
Premium
A hand points to a 2026 financial chart displayed on a laptop screen, showing upward trend graphs
Dynamic Financial Growth Digital Chart Display
World Map with Falling Line Graphs Indicating Global Economic Decline
Dynamic Forex Trading Graphs with Increasing Numbers
Premium
Close up shot of a magnifying glass over blue toned financial data sheets with graphs, tables, and numbers for business analysis and research.
Dynamic Digital Data Dashboard with Analytics Charts and Graphs
Financial Data Analysis Vibrant Graphs on Blue Background
Dynamic Digital Stock Market Ticker with Growing Graph Trends
Financial Graphs with Social Media Analytics on Digital Chart
Premium
Dynamic financial chart overlaying stunning cityscape at night, symbolizing growth and opportunity in the modern business world with vibrant colors
Futuristic Digital Interface with DNA and Brain Diagrams
Digital Data Analysis and Visualization with Line Graph
Cityscape with Digital Stock Market Graphs and Statistics
Dynamic Financial Data on Dark Background With Colorful Graphs
Premium
Inflation and tax concept Rising inflation rates graph. Global economy recession. interest rate, business, finance and investment background. Stack of coins money with financial graph and copy space
Data Analysis with Advanced Technology Interface Details Profusion
Analyzing Accelerating Data Trends on Grid with Tech Insights
Financial Data Visualization with Cityscape Overlay
Premium
Blue growth graph business chart data diagram on success financial presentation background
Abstract Digital Stock Market Analysis with Graphs
Dynamic Financial Data Visualization over Urban Silhouette
Dynamic Stock Market Graphs with Trends and Data Alerts
Premium
Business professional analyzes financial reports and builds charts in a spreadsheet on a desktop computer in a modern office with colleagues working in the background
Premium
Transparent or png stock market investment trading graph growth.Trade business analytics graph and financial chart.
Data Analysis Graphics on Digital Grid Background
Global Economic Trends Highlighted on World Map with Graphs
Futuristic Keyboard Analytics Display with Digital Graphs and Numbers
Financial Data Analysis in Digital Interface with Graphs
Premium
Strategic financial discussion between business partners, analyzing investment data and planning future growth in a corporate environment
Financial Data Charts in Shimmering Blue Digital Space
Dynamic Financial Data Overlaid on Grid Background
Dynamic Green Stock Chart on Digital Grid Background
Explore More Free Stock Images