- Home >
- Stock Photos >
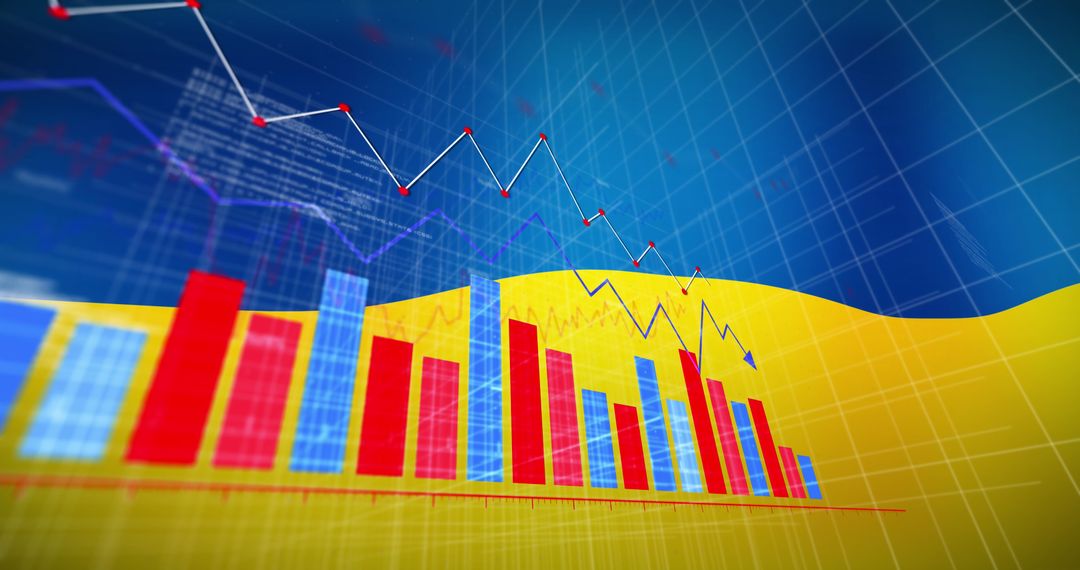
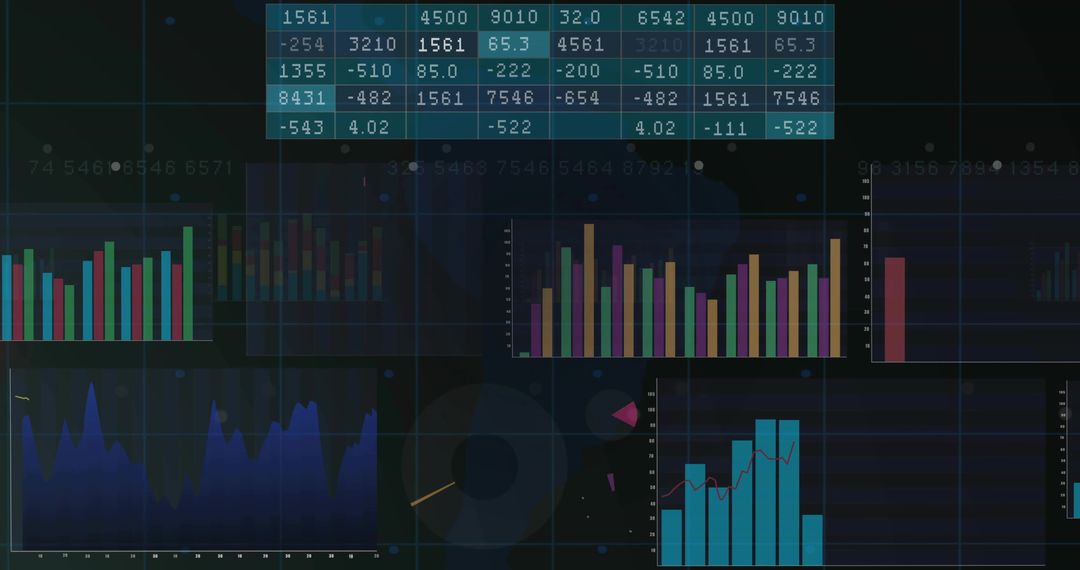
- Digital Chart Display Showing Rising and Falling Trends
Digital Chart Display Showing Rising and Falling Trends Image
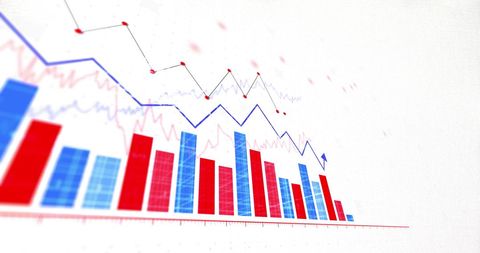
Depicts digital charts with red and blue bars and line graphs, showcasing financial or economic trends. Useful for illustrating financial reports, economic analysis, digital interfaces, statistics presentations, technology-related projects, or business strategy discussions.
Powered by 


2
downloads
downloads
Tags:
More
Credit Photo
If you would like to credit the Photo, here are some ways you can do so
Text Link
photo Link
<span class="text-link">
<span>
<a target="_blank" href=https://pikwizard.com/photo/digital-chart-display-showing-rising-and-falling-trends/a4a3c697e2d635d5140c5f621a5453d1/>PikWizard</a>
</span>
</span>
<span class="image-link">
<span
style="margin: 0 0 20px 0; display: inline-block; vertical-align: middle; width: 100%;"
>
<a
target="_blank"
href="https://pikwizard.com/photo/digital-chart-display-showing-rising-and-falling-trends/a4a3c697e2d635d5140c5f621a5453d1/"
style="text-decoration: none; font-size: 10px; margin: 0;"
>
<img src="https://pikwizard.com/pw/medium/a4a3c697e2d635d5140c5f621a5453d1.jpg" style="margin: 0; width: 100%;" alt="" />
<p style="font-size: 12px; margin: 0;">PikWizard</p>
</a>
</span>
</span>
Free (free of charge)
Free for personal and commercial use.
Author: People Creations
Similar Free Stock Images

Premium


Premium


Premium


Premium


Premium


Premium


Premium


Premium


Premium


Premium


Premium


Premium


Premium


Premium


Premium


Premium


Premium


Premium


Premium


Premium


Premium


Premium


Premium


Premium