- Home >
- Stock Photos >
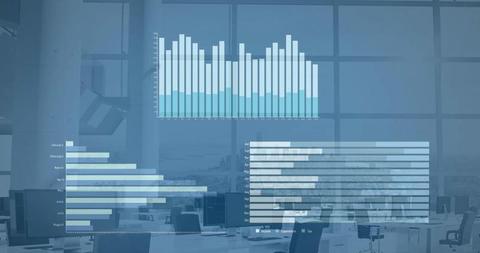
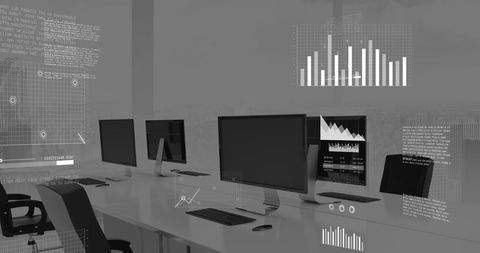
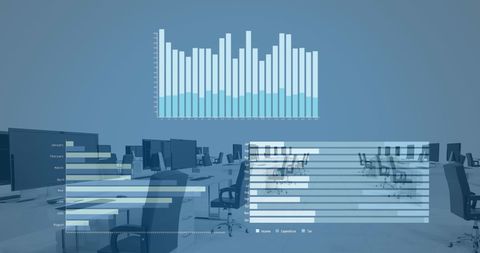
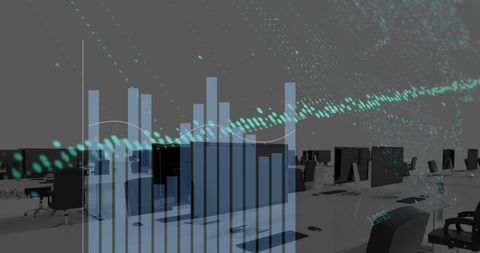
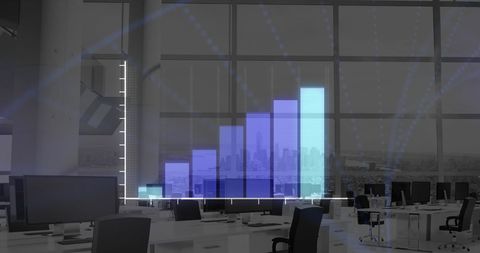
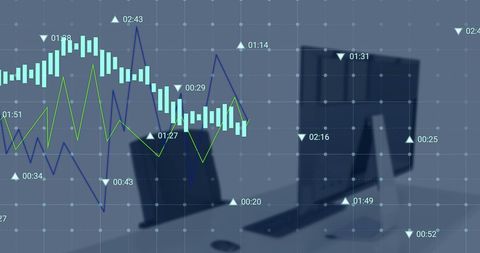
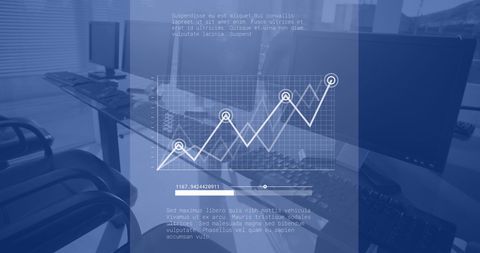
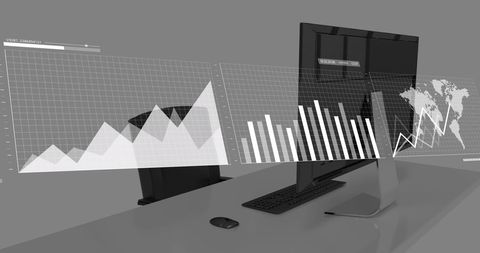
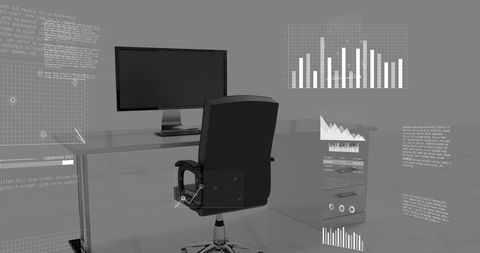
- Digital Chart Projection on Office Desk
Digital Chart Projection on Office Desk Image

Visualization showing statistical charts projected onto an office desk with a computer. Represents digital data analysis in a business setting. Useful for illustrating digital transformation, business intelligence, technology in offices, or financial planning.
Powered by 


6
downloads
downloads
Tags:
More
Credit Photo
If you would like to credit the Photo, here are some ways you can do so
Text Link
photo Link
<span class="text-link">
<span>
<a target="_blank" href=https://pikwizard.com/photo/digital-chart-projection-on-office-desk/574387e63d746cace686ebece7665a18/>PikWizard</a>
</span>
</span>
<span class="image-link">
<span
style="margin: 0 0 20px 0; display: inline-block; vertical-align: middle; width: 100%;"
>
<a
target="_blank"
href="https://pikwizard.com/photo/digital-chart-projection-on-office-desk/574387e63d746cace686ebece7665a18/"
style="text-decoration: none; font-size: 10px; margin: 0;"
>
<img src="https://pikwizard.com/pw/medium/574387e63d746cace686ebece7665a18.jpg" style="margin: 0; width: 100%;" alt="" />
<p style="font-size: 12px; margin: 0;">PikWizard</p>
</a>
</span>
</span>
Free (free of charge)
Free for personal and commercial use.
Author: People Creations
Similar Free Stock Images
Loading...

Premium


Premium


Premium


Premium


Premium


Premium

Premium


Premium


Premium


Premium


Premium


Premium

Premium


Premium


Premium


Premium

Premium


Premium

Premium


Premium


Premium


Premium


Premium


Premium


Premium