- Home >
- Stock Photos >
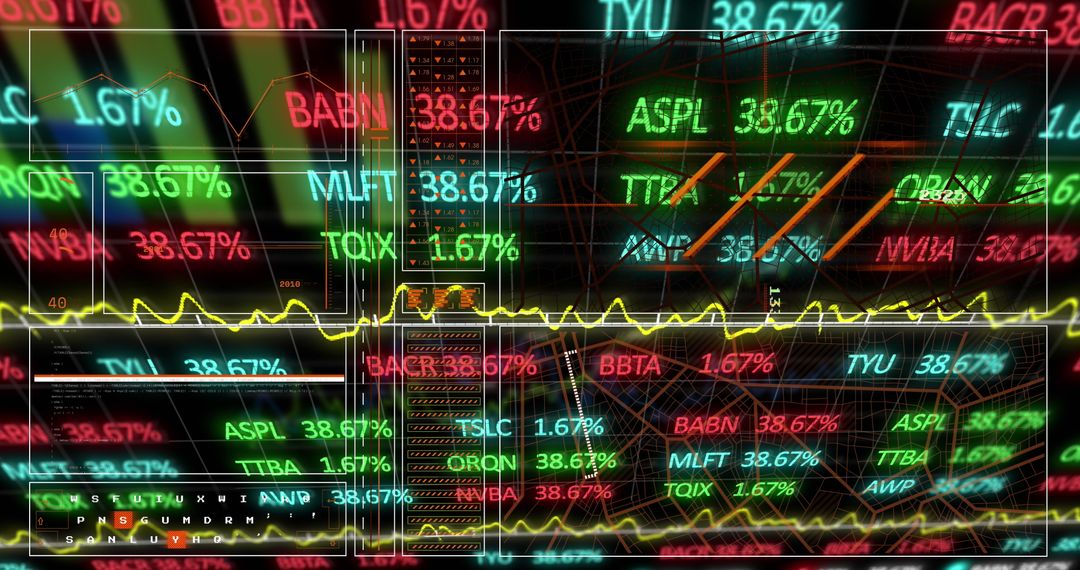
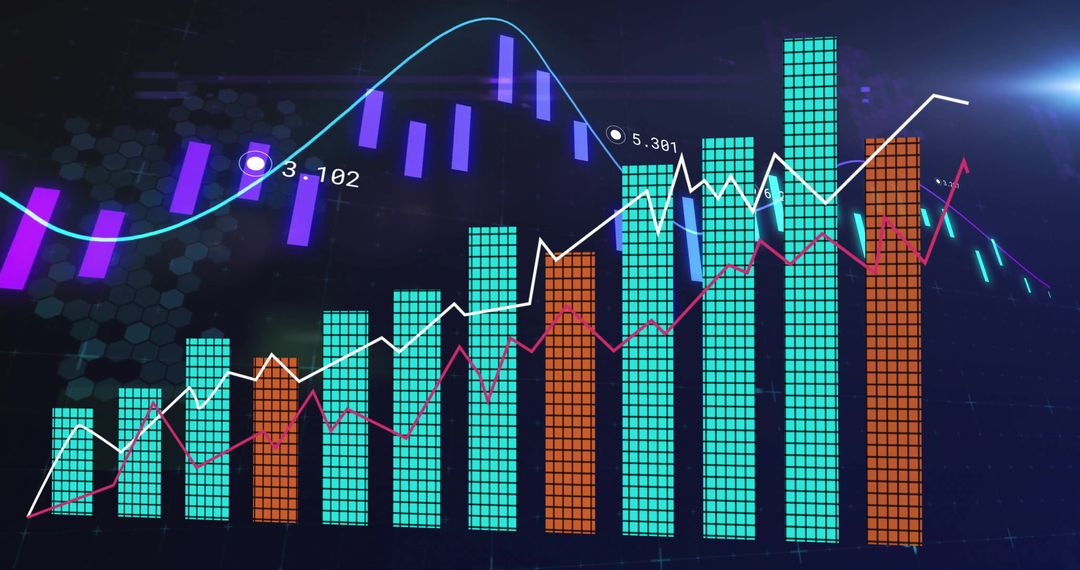
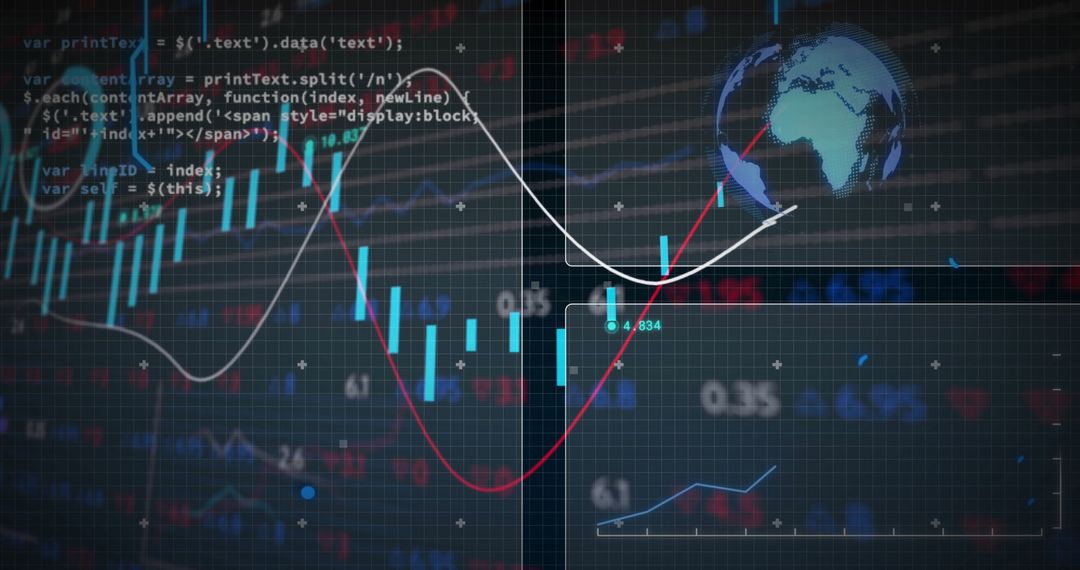
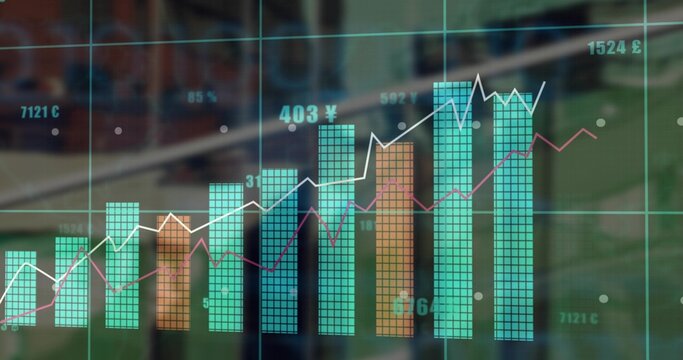
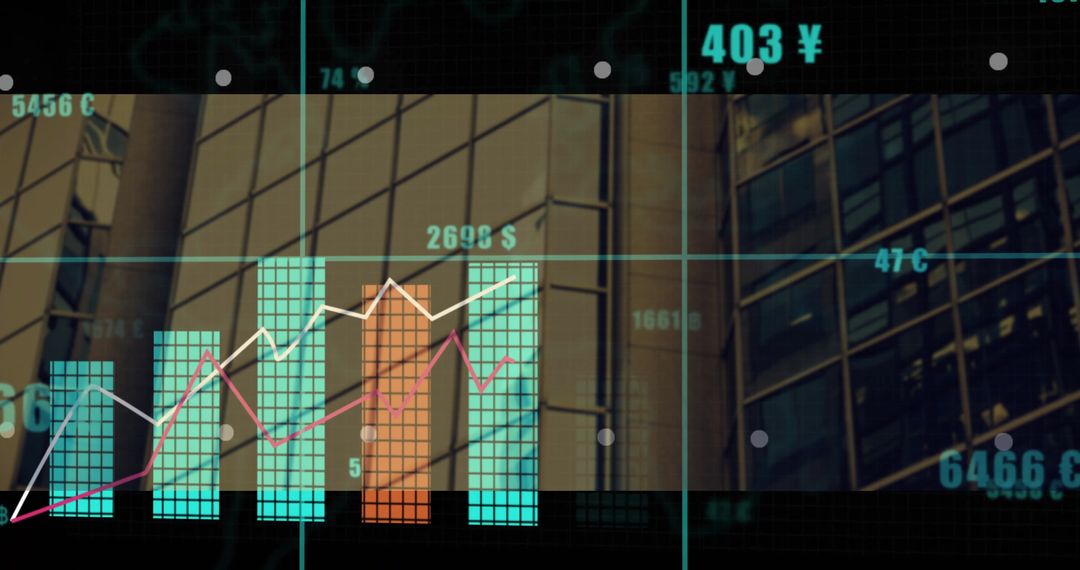
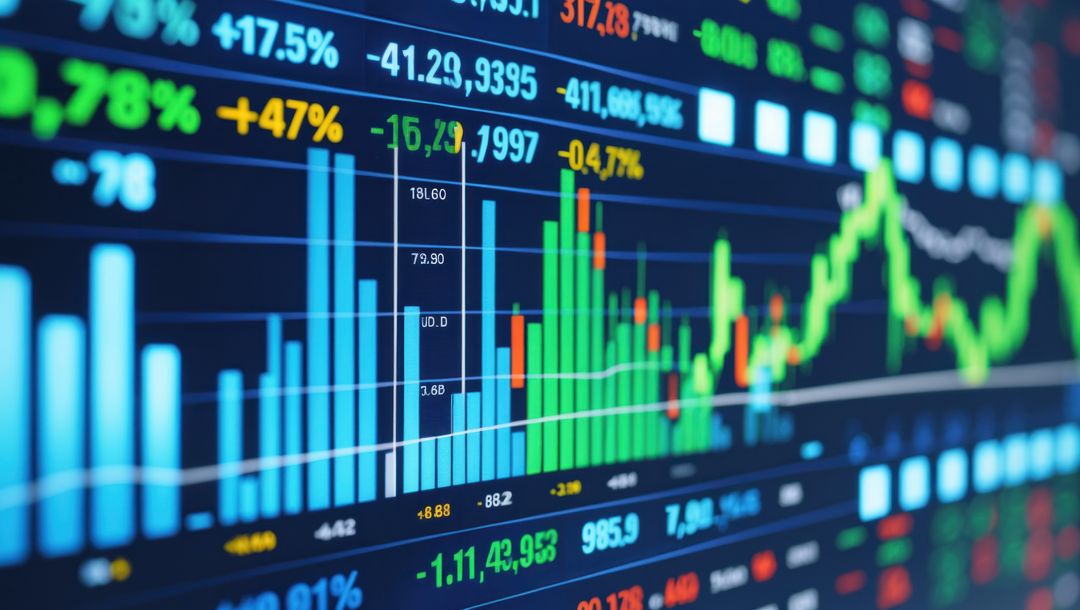
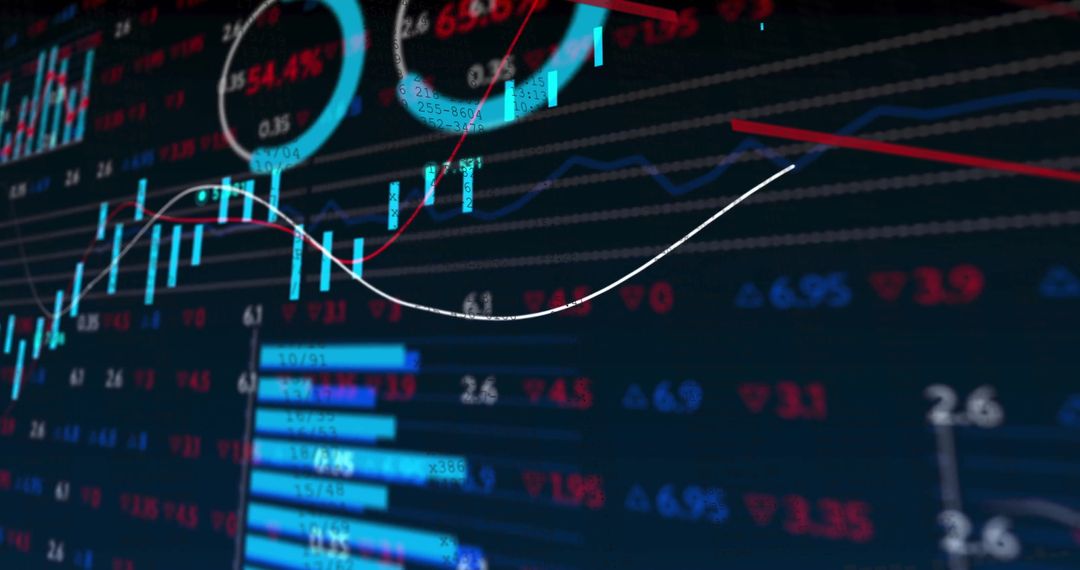
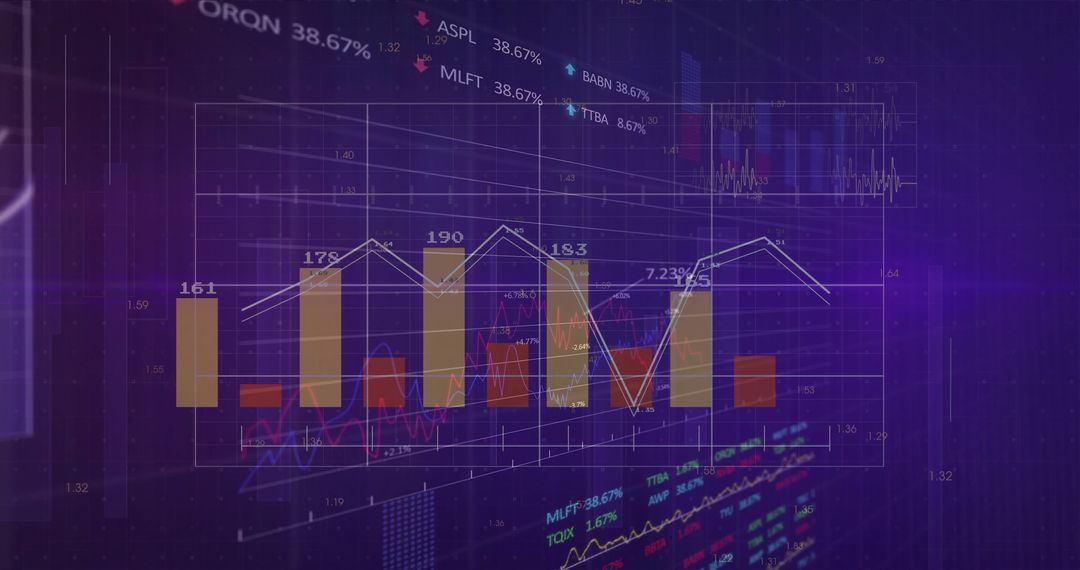
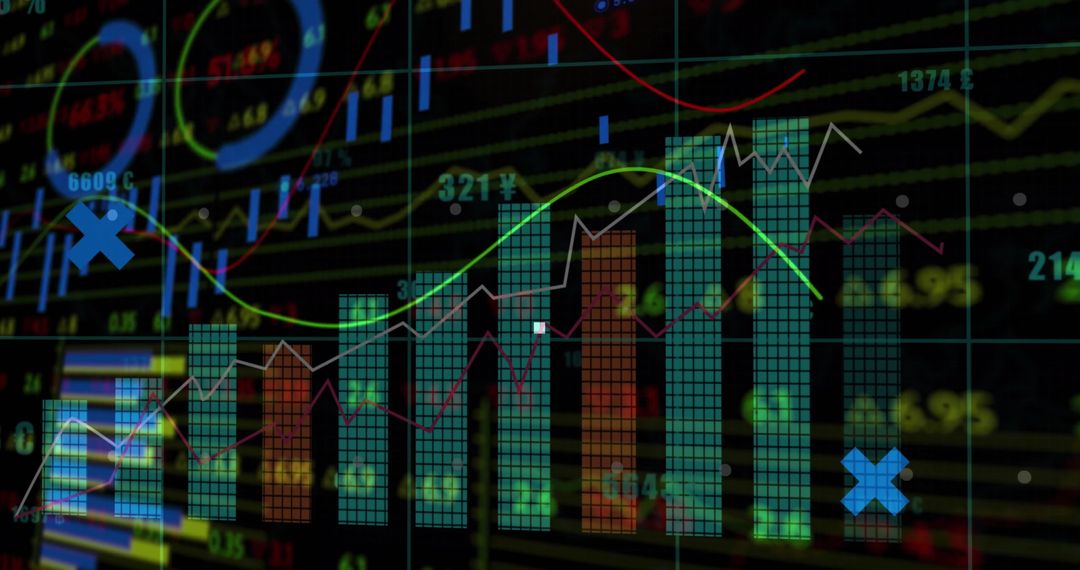
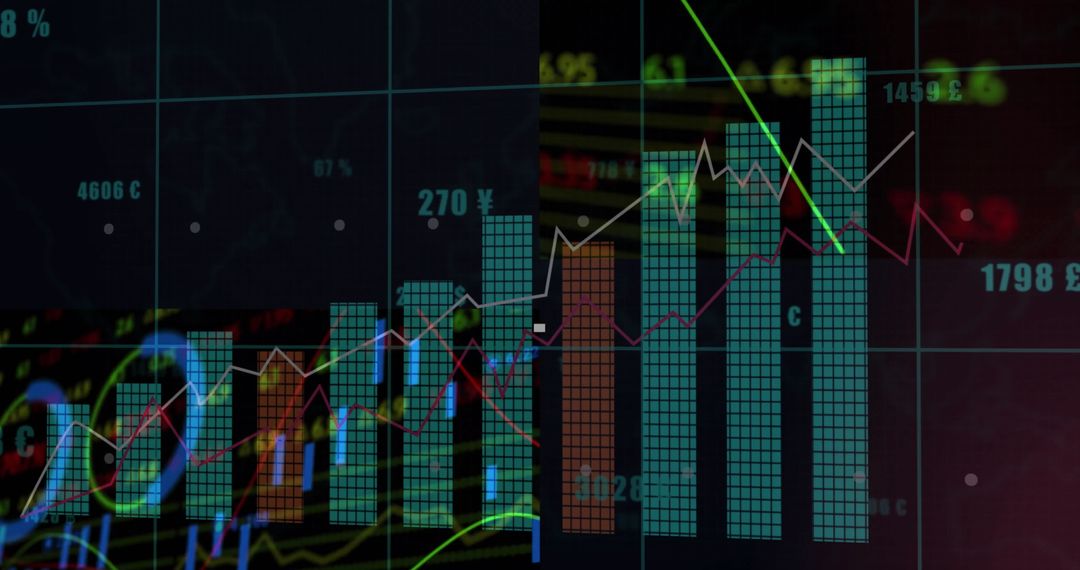
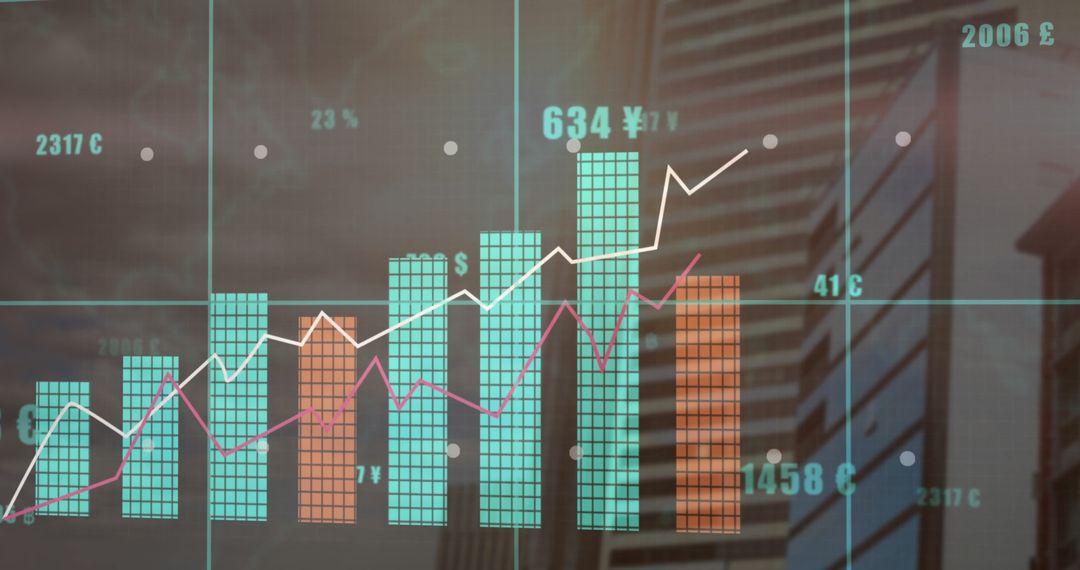
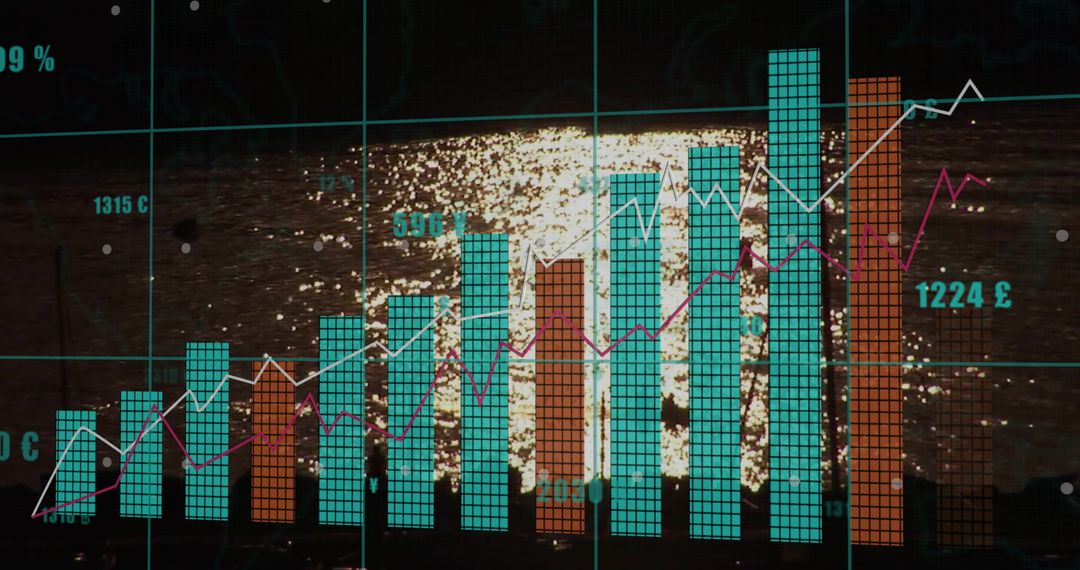
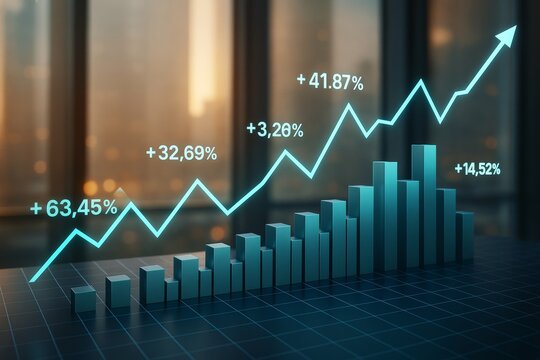
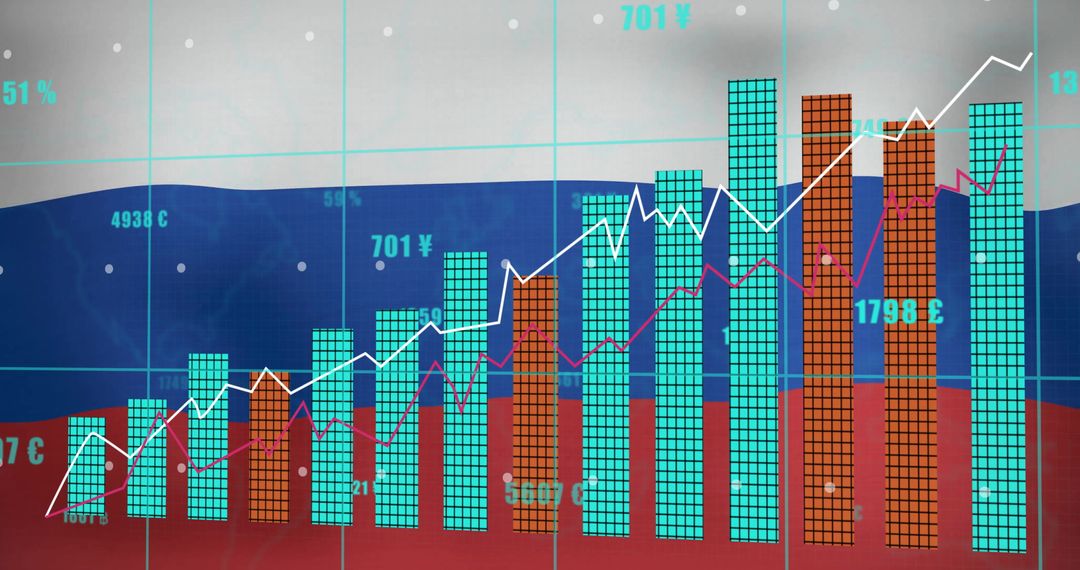
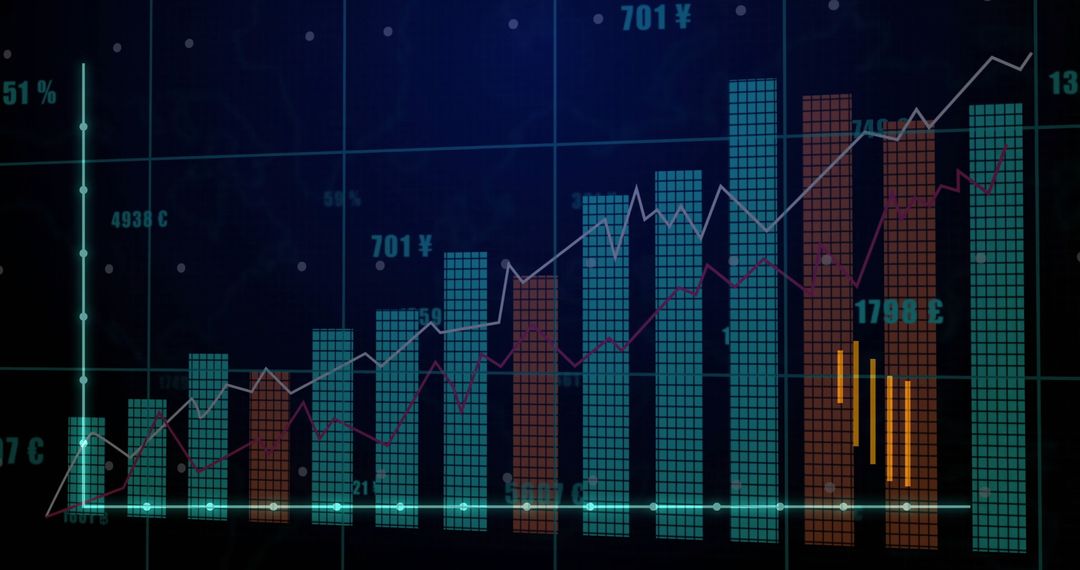
- Digital Chart with Bar Graph and Currency Symbols for Financial Analytics
Digital Chart with Bar Graph and Currency Symbols for Financial Analytics Image
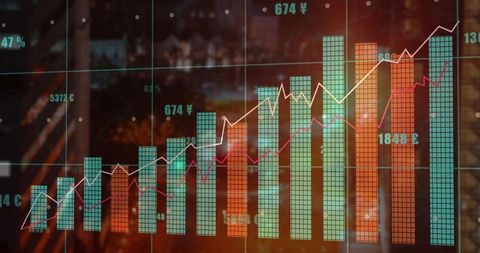
Visual representation of financial analytics with bar graphs showing growth trends, overlayed by currency symbols like dollar, euro, yen, illustrating economic or investment analysis. Vivid colors and charts create a futuristic feel, making it suitable for presentations, reports, or websites focused on finance, technological advancement, or market predictions.
Powered by 


0
downloads
downloads
Tags:
More
Credit Photo
If you would like to credit the Photo, here are some ways you can do so
Text Link
photo Link
<span class="text-link">
<span>
<a target="_blank" href=https://pikwizard.com/photo/digital-chart-with-bar-graph-and-currency-symbols-for-financial-analytics/c79b1254ea5cfb941d2e4be6530e7f82/>PikWizard</a>
</span>
</span>
<span class="image-link">
<span
style="margin: 0 0 20px 0; display: inline-block; vertical-align: middle; width: 100%;"
>
<a
target="_blank"
href="https://pikwizard.com/photo/digital-chart-with-bar-graph-and-currency-symbols-for-financial-analytics/c79b1254ea5cfb941d2e4be6530e7f82/"
style="text-decoration: none; font-size: 10px; margin: 0;"
>
<img src="https://pikwizard.com/pw/medium/c79b1254ea5cfb941d2e4be6530e7f82.jpg" style="margin: 0; width: 100%;" alt="" />
<p style="font-size: 12px; margin: 0;">PikWizard</p>
</a>
</span>
</span>
Free (free of charge)
Free for personal and commercial use.
Author: Creative Art
Similar Free Stock Images

Premium


Premium


Premium


Premium


Premium


Premium


Premium


Premium


Premium


Premium


Premium


Premium


Premium


Premium


Premium


Premium


Premium


Premium


Premium


Premium


Premium


Premium


Premium


Premium