
- Home >
- Stock Photos >
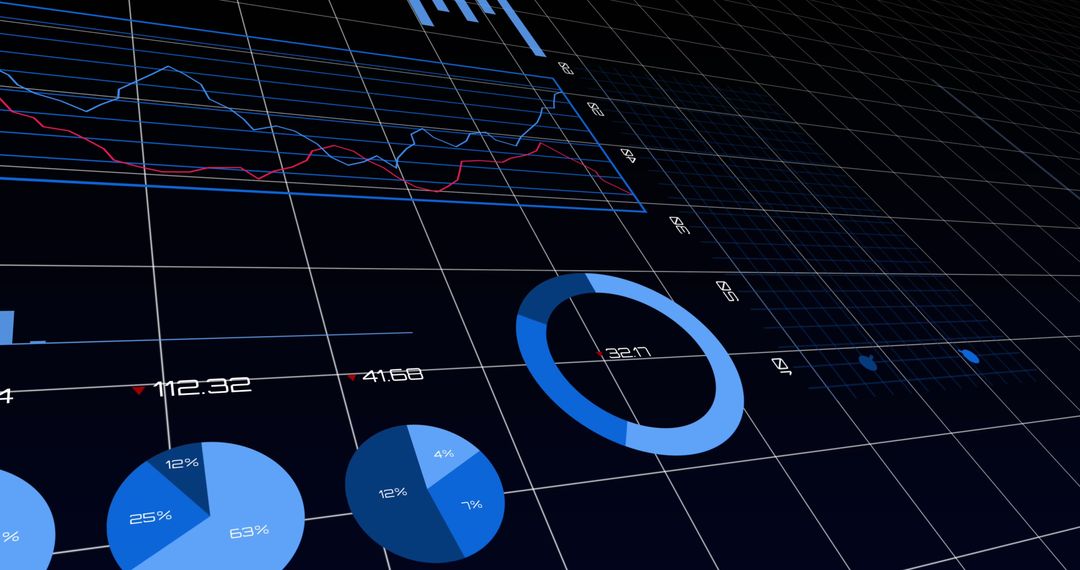
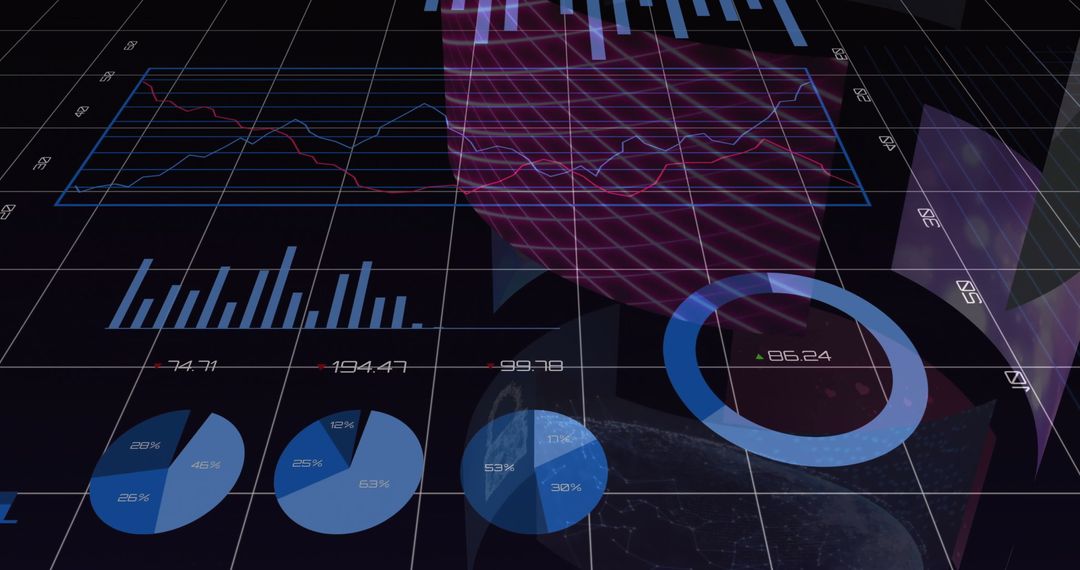
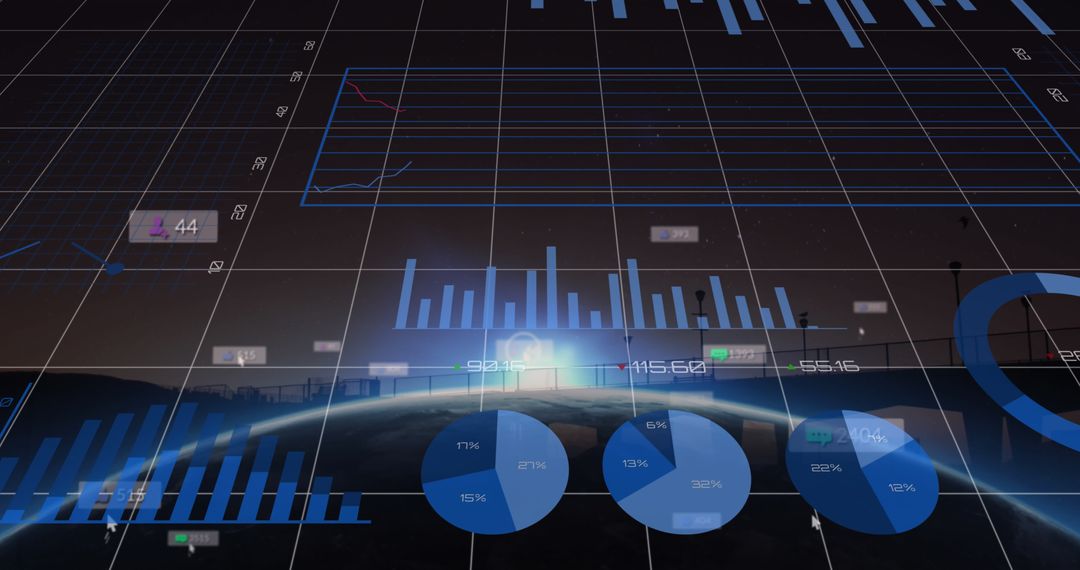
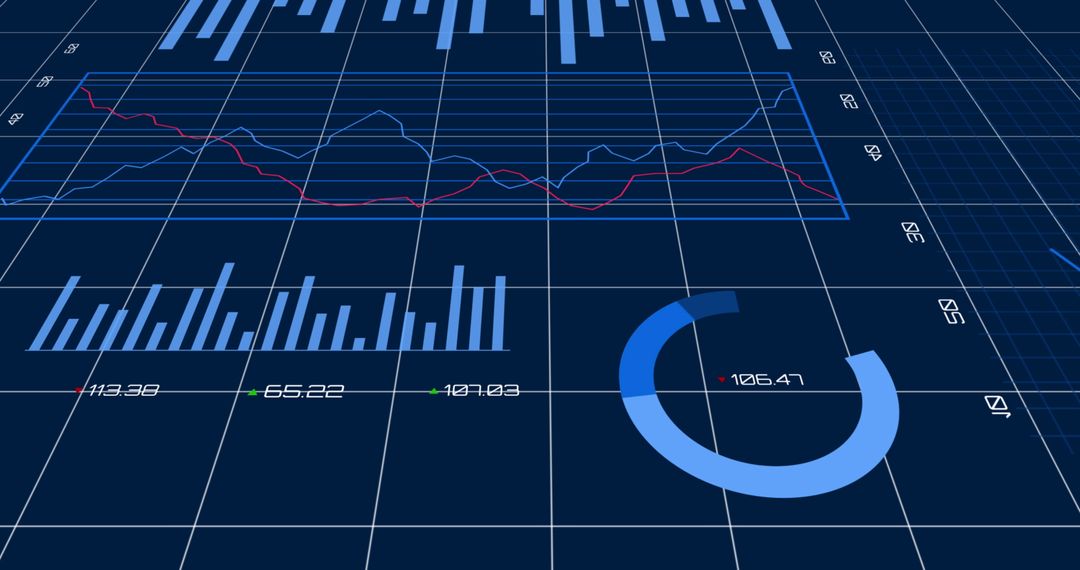
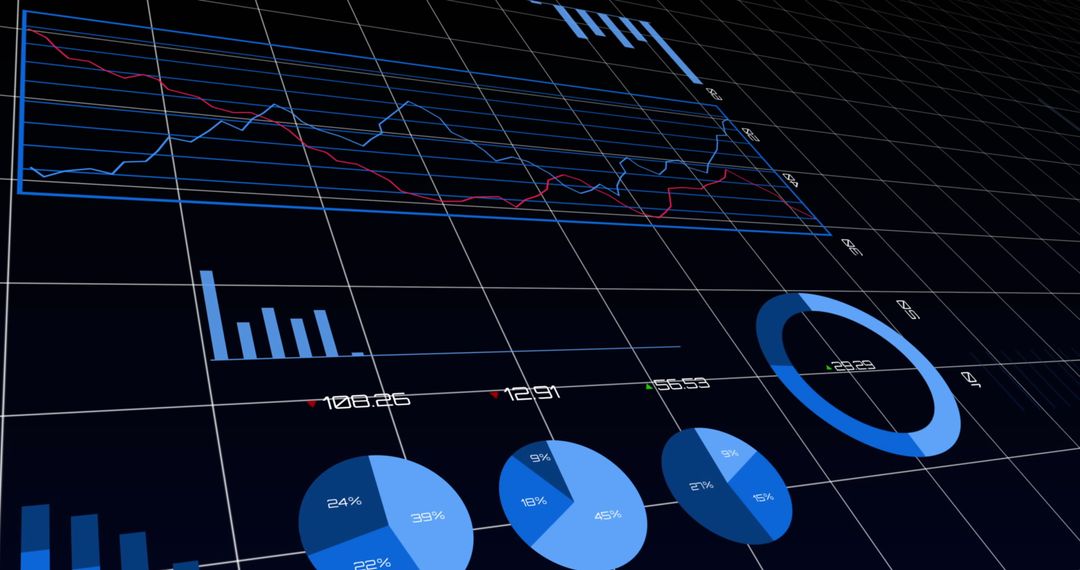
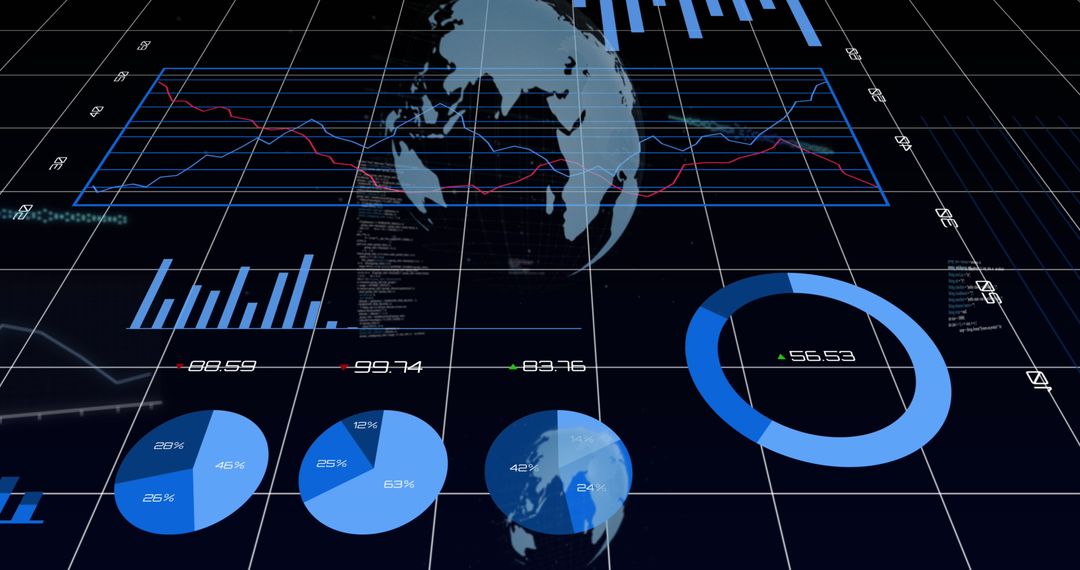
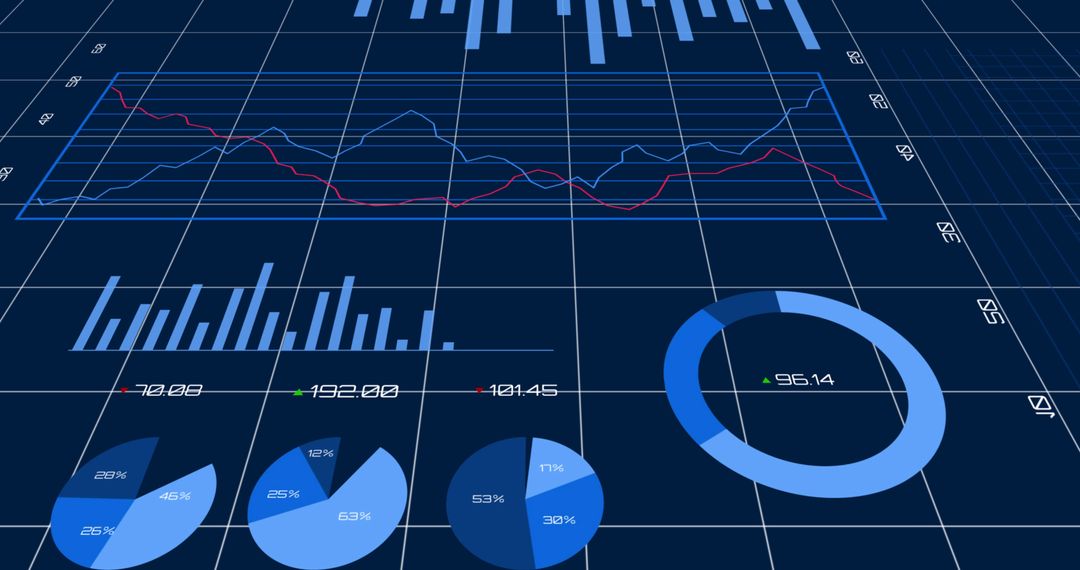
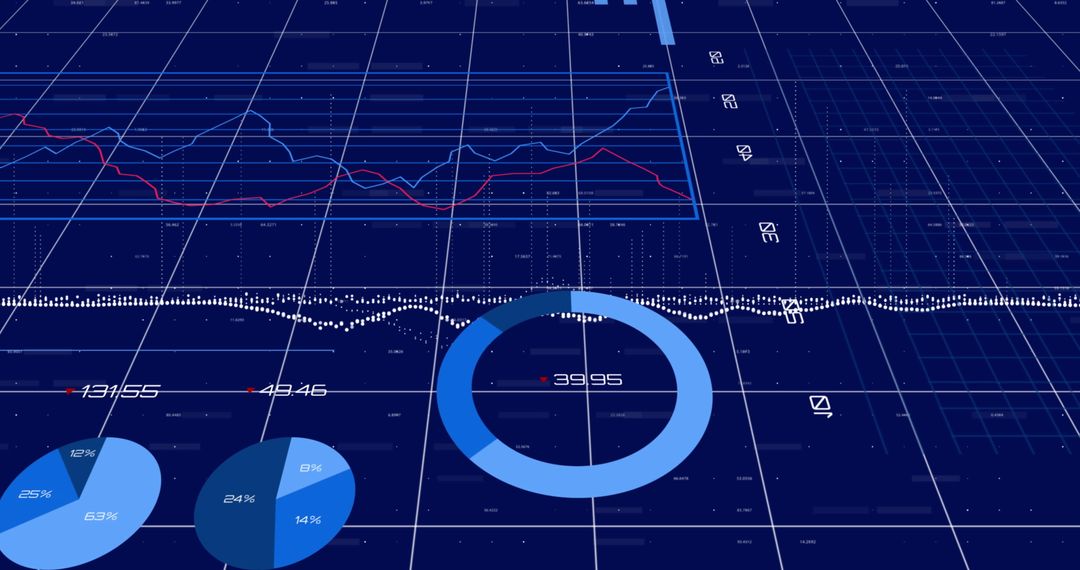
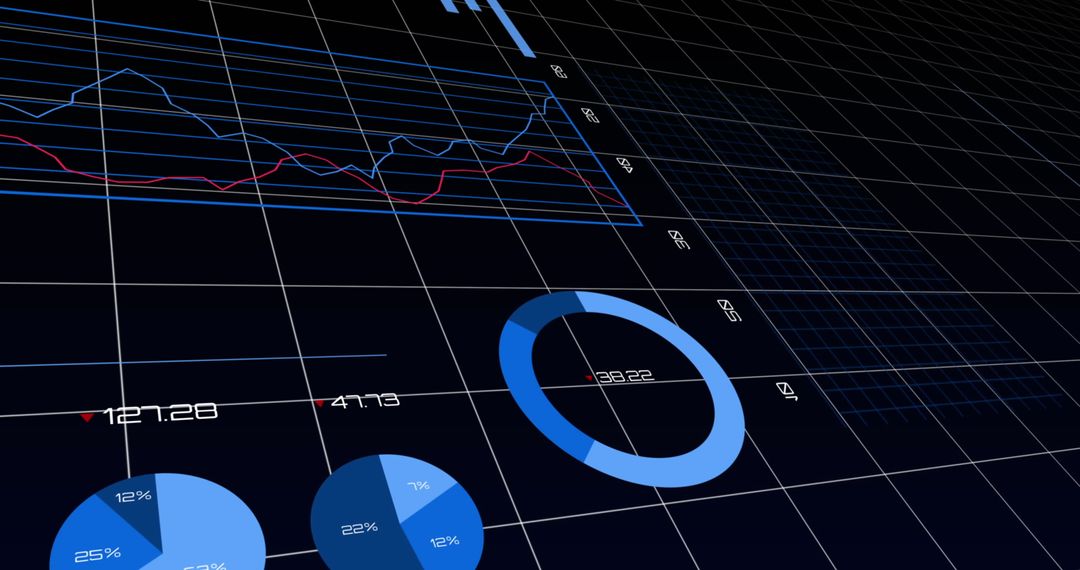
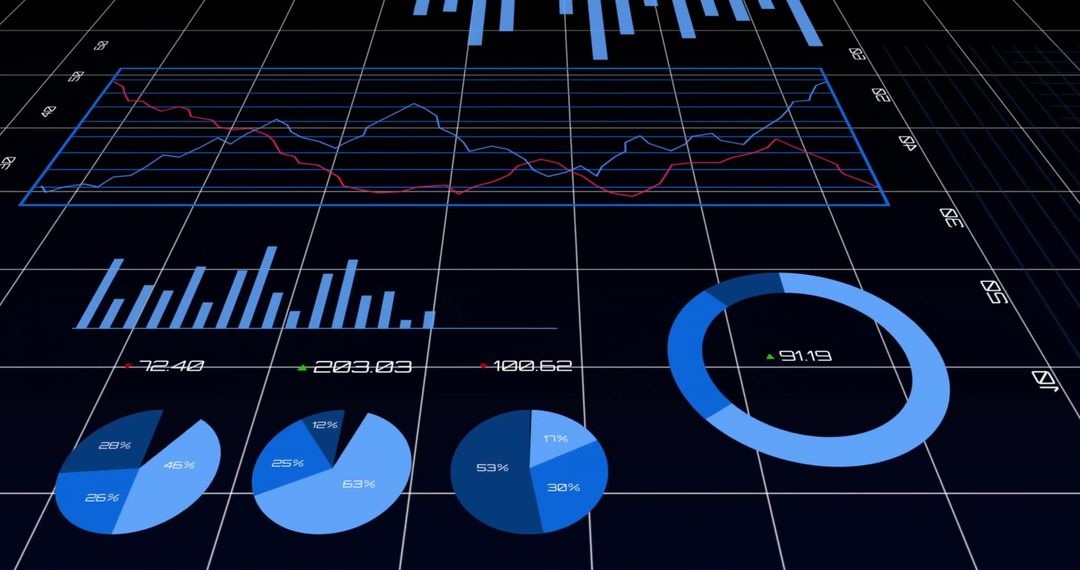
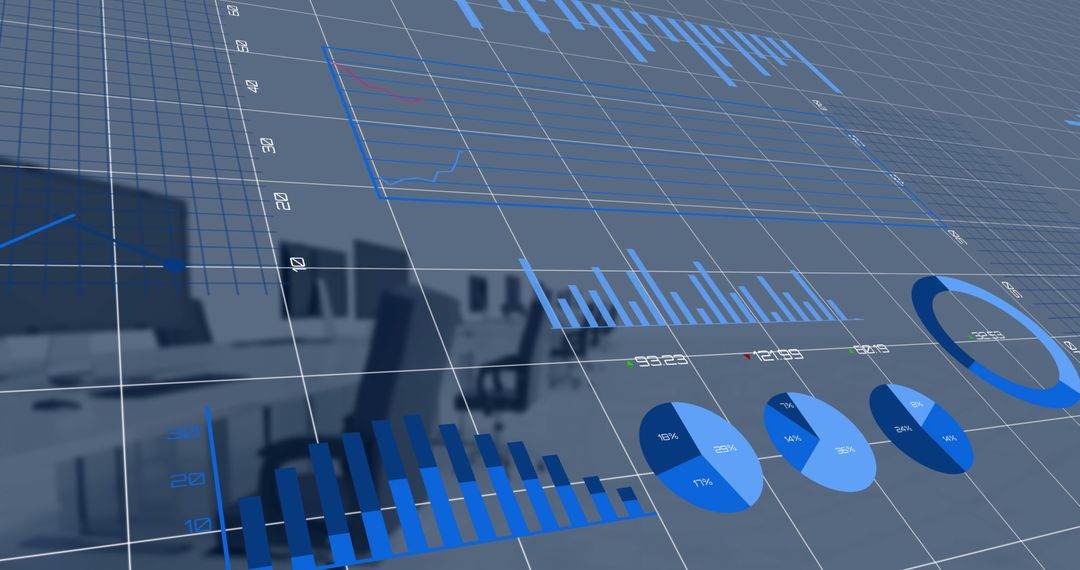
- Digital Charts and Graphs Display for Finance and Statistics
Digital Charts and Graphs Display for Finance and Statistics Image

Illustration shows a series of digital charts and graphs over a grid, symbolizing global finance. Features include bar graphs, line graphs, pie charts, all arranged on a digital display. Useful for conveying themes related to data analysis, market trends, and financial reports. Ideal for business presentations, website backgrounds related to finance, or content about statistics and analytics.
Powered by  - Get 15% off with code: PIKWIZARD15


2
downloads
downloads
Tags:
More
Credit Photo
If you would like to credit the Photo, here are some ways you can do so
Text Link
photo Link
<span class="text-link">
<span>
<a target="_blank" href=https://pikwizard.com/photo/digital-charts-and-graphs-display-for-finance-and-statistics/6aacd82337f6aab5319f6590b7e8509a/>PikWizard</a>
</span>
</span>
<span class="image-link">
<span
style="margin: 0 0 20px 0; display: inline-block; vertical-align: middle; width: 100%;"
>
<a
target="_blank"
href="https://pikwizard.com/photo/digital-charts-and-graphs-display-for-finance-and-statistics/6aacd82337f6aab5319f6590b7e8509a/"
style="text-decoration: none; font-size: 10px; margin: 0;"
>
<img src="https://pikwizard.com/pw/medium/6aacd82337f6aab5319f6590b7e8509a.jpg" style="margin: 0; width: 100%;" alt="" />
<p style="font-size: 12px; margin: 0;">PikWizard</p>
</a>
</span>
</span>
Free (free of charge)
Free for personal and commercial use.
Author: People Creations
Similar Free Stock Images

Premium


Premium


Premium


Premium


Premium


Premium


Premium


Premium


Premium


Premium


Premium


Premium


Premium


Premium


Premium


Premium


Premium


Premium


Premium


Premium


Premium


Premium


Premium


Premium

