
- Home >
- Stock Photos >
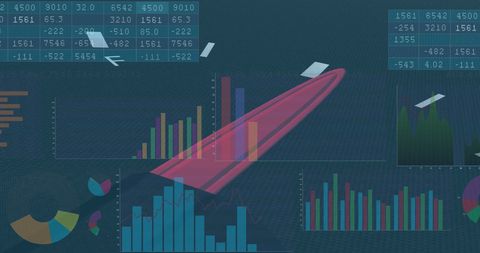
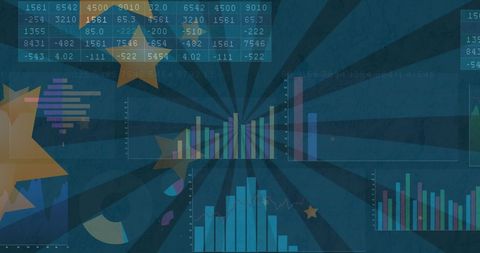
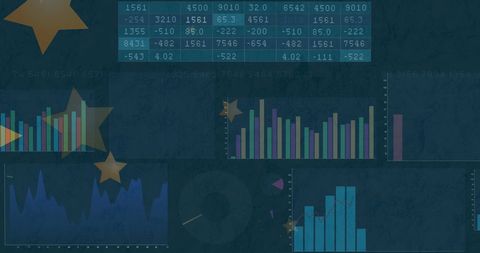
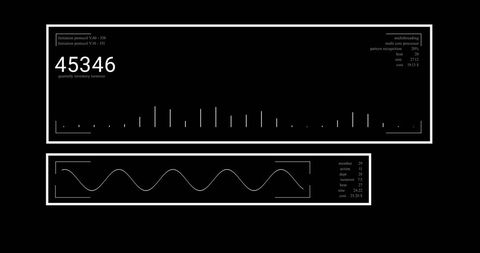
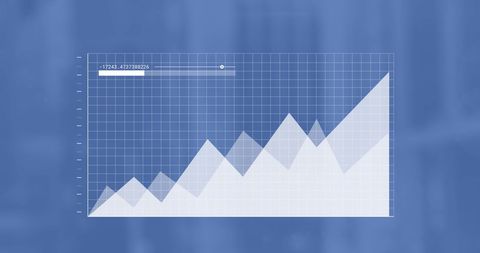
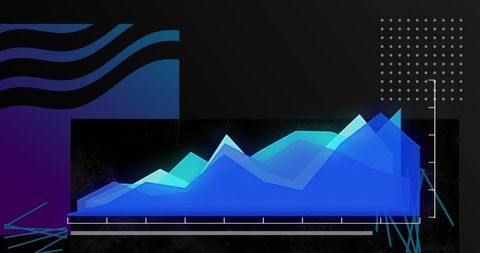
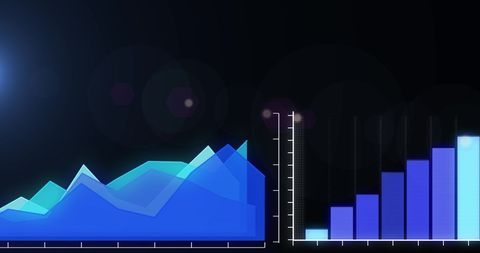
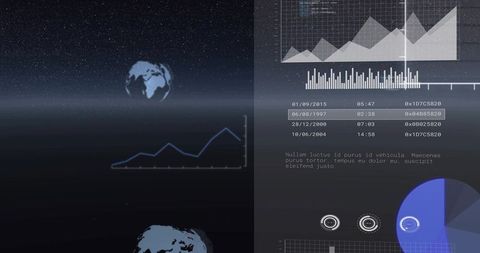
- Digital Charts on Dark Background Highlighting Data Analytics
Digital Charts on Dark Background Highlighting Data Analytics Image

Displaying a sophisticated interface with overlapping line and bar charts against a deep blue background. Suitable for illustrating concepts in data analytics, business intelligence, or technological innovations. Ideal for use in presentations, digital platforms, or marketing materials related to business growth and data processing.
Powered by 


downloads
Tags:
More
Credit Photo
If you would like to credit the Photo, here are some ways you can do so
Text Link
photo Link
<span class="text-link">
<span>
<a target="_blank" href=https://pikwizard.com/photo/digital-charts-on-dark-background-highlighting-data-analytics/cd564ea495aeb2b0513a7347799d240c/>PikWizard</a>
</span>
</span>
<span class="image-link">
<span
style="margin: 0 0 20px 0; display: inline-block; vertical-align: middle; width: 100%;"
>
<a
target="_blank"
href="https://pikwizard.com/photo/digital-charts-on-dark-background-highlighting-data-analytics/cd564ea495aeb2b0513a7347799d240c/"
style="text-decoration: none; font-size: 10px; margin: 0;"
>
<img src="https://pikwizard.com/pw/medium/cd564ea495aeb2b0513a7347799d240c.jpg" style="margin: 0; width: 100%;" alt="" />
<p style="font-size: 12px; margin: 0;">PikWizard</p>
</a>
</span>
</span>
Free (free of charge)
Free for personal and commercial use.
Author: Awesome Content
Similar Free Stock Images

Premium


Premium


Premium


Premium


Premium


Premium


Premium

Premium


Premium


Premium


Premium


Premium


Premium


Premium

Premium

Premium


Premium


Premium


Premium


Premium


Premium


Premium


Premium


Premium

Premium


Explore More Free Stock Images