1. Home > 
  2. Stock Photos > 
  3. Digital Complexity Unveiled in 3D Financial Analytics Sphere

Digital Complexity Unveiled in 3D Financial Analytics Sphere Image

Digital Complexity Unveiled in 3D Financial Analytics Sphere

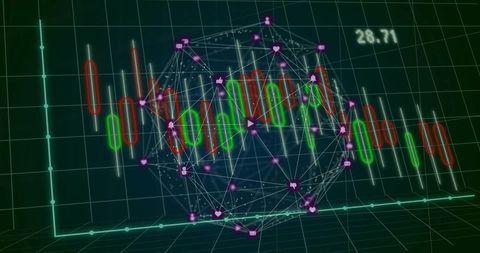
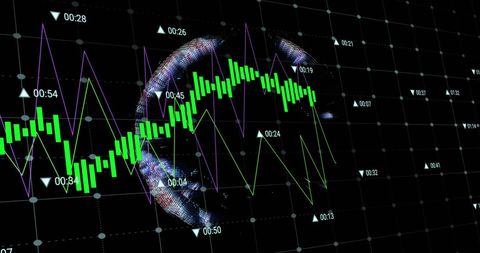
Image depicting a digital dashboard displaying a complex mix of finance elements. A candlestick chart is overlaid with a 3D sphere, encircled by interconnected media icons and the number 28.71 visible in the background. Ideal for use in financial technology presentations, investment analysis materials, blogs on stock trading strategies, and articles discussing digital transformation in the finance sector.

Powered by Adobe logo
Hand holding a magnifying glass to analyze a 3D holographic icon of a financial candlestick chart - Powered by AdobeFuturistic digital financial data visualization with glowing candlestick charts and abstract bubbles - Powered by AdobeGlobe with glowing dotted map and floating holographic financial chart candles conveying global market data and dynamic trading sentiment in futuristic blue atmosphere - Powered by AdobeDisplaying neon candlestick and teal bar charts on virtual trading dashboard, showing dotted globe - Powered by AdobeSpinning 3D blockchain sphere on screen, with binary digits, Block chain text, charts and graphs - Powered by Adobe

Credit Photo

If you would like to credit the Photo, here are some ways you can do so

Free (free of charge)

Free for personal and commercial use.

Author: Authentic Images

Similar Free Stock Images

Dynamic Financial Data with Graph Trends and Statistics
Premium
Showing green candlestick chart purple line graph in data UI, numeric grid labels, network sphere
Abstract Financial Data Analysis and Stock Market Trends
Premium
Displaying 3D spheres floating over analytics UI, with percentage labels, testing bars, pink streak
Neon Candlestick Chart Showing Market Volatility on Futuristic Blue Grid Dashboard
Global Finance and COVID-19 Impact Representation
Digital Financial Data Illustration with Neon Graphs and Nodes
Rotating holographic globe emitting neon circuits and green waveform HUD interface data visualizatio
Digital Globe with Stock Market Data and Network Icons
Digital Data Interface on World Map Focusing Global Business Analytics
Analytical Dashboard with Candlestick Chart and Dotted Trend Line
Abstract Digital Stock Market Data Visualization
Abstract Concept of Data Processing and Global Networking
Digital Financial Data Analysis on Abstract Background
Digital Network Connections with Financial Icons on Virtual Display
Digital Interface Display with Financial Graph Icons Overlay
Futuristic Financial Data Analysis and Global Connections
Finance Transforming with DNA and Digital Technology
Futuristic Digital Network with Green Light Trajectories
Digital Data Processing Elements Over Black Background
Financial Data Overlaid on DNA with COVID-19 Imagery
Futuristic Data Graph with Digital Interface Elements
Digital Data Charts and Graphs over Black Background
Dynamic Financial Data Chart on Dark Digital Dashboard
Glow Green Digital Media Network Connections
Futuristic Digital Network with Data Streams and Connections
Digital Data Analytics with Globe Background
Financial Data Graph with Digital Elements and Growth Indicators
3D Financial Market Analysis with Declining Stock Graph
Digital Financial Data Visualization with Graphs and Charts
Digital Network Over Financial Graph with Data Integration Overlay
Pulsing Global Candlestick Market Chart on Neon 3D Grid with White Globe
Futuristic Data Network with Hexagonal Tunnel Backdrop
Digital Financial Network and Data Charts
Financial Data Analytics with Network Connections on Green Grid
Interactive Financial Network with Data Visualization
Global Financial Data Overlay with Vibrant Graphs on World Map
Digital Data Processing and Connections with Futuristic Interface
Dynamic Stock Market Data Analysis on Blue Grid Background
Abstract Futuristic Data Network and Digital Finance Concept
Data Visualization on Digital Grid with Technological Interface
Digital Data Visualization on Futuristic Network Servers
Dynamic Financial Data Analysis with Illuminated Graphs
Futuristic Global Data Processing and Analysis
Digital Data Network with Financial and Business Icons
Digital Network with Connected Icons and Data Streams
Digital Financial Chart and Chemical Structurals Illustration
Digital Financial Data Analysis with Chart and Markers
Financial Data Analytics on Neon Black Grid Background
Digital Interface with Data Processing and Business Connectivity Icons
Global Stock Market Chart Over World Map
Dynamic Financial Data Tracking with Charts and Graphs
Finance Data Learning: Economic Trends and Market Analysis
Premium
Showing data sphere on financial interface, with candlesticks, streams, code panels, map outlines
Digital Interface with Data Sharing and Connection Network
Data Visualization with Globe and Digital Interface Elements
Global Network and Financial Data Visualization on Dark Background
Global Financial Data Network with Digital Connections
Abstract Data Visualization on Blue Background for Technology Concept
Colorful Digital Stock Market Graph on Grid Background
Futuristic Digital Financial Graphs with Energy Icon
Digital Network with Financial and Business Icons in Interconnected Web
Digital Shield Padlock Illustrates Advanced Cybersecurity Protection
Abstract Digital Chart on Black Background Representing Data Analysis
Data Processing and Analytics on Global Finance Map
Digital Finance Concept with Data Visualization and Network Icons
Dynamic Financial Data with Interactive Graphs on Digital Screen
Digital Data Processing on Global Technological Interface
Neon Candlestick Trading Dashboard Showing Social Sentiment Annotations and Trend Line
Colorful Financial Data Visualization with Digital Graph Elements
Complex Data Analytics Overlay in High-Tech Server Room
Abstract Globe of Digital Finance Icons and Market Data Background
Abstract Digital Interface with Glowing Data Metrics
Digital Data Processing Over Global Network Globe
Dynamic Financial Fluctuation on Digital Graph
Level Up Theme Over Digital Cityscape and Globe Design
3D Candlestick Chart with Digital Notifications Overlay
3D Candlestick Chart with Social Media Reactions
Dynamic Financial Graph Visualizing Market Trends
Digital Data Processing Around Globe Connections
Financial Data Overlay on Computer Servers Illustrating Global Business Trends
Dynamic Stock Market Graphs and Financial Data
Colorful Financial Data Analytics and Global Market Trends
Digital Network Connections Visualization with Data Analysis Graphs
Dynamic Data Visualization with Financial and Technological Elements
Global Business Data Analytics on World Map
Global Finance Technology Concept with Spinning Icons
Digital Interface Abstract Screen in Server Room Data Concept
Dynamic Financial Data Chart on Blue Background
Abstract Financial Data Visualization with Graphs
Interconnected Network of Technological Media Icons on Dark Digital Background
Futuristic Financial Data Analytics Interface
Abstract Financial Data Visualization on Digital Screen with World Map
Financial Data Visualization Over Construction Site
3D Candlestick Chart with Falling Stock Value
Data Visualization on Blue Digital Interface
Digital Icons on Spinning Globe with Data Processing Overlay
Global Data Processing on Digital Earth Background
Advanced Digital Graph Illustrating Stock Market Trends
Digital Grid Displaying Financial Line Graphs and Candlesticks
3D Stock Market Graph in Digital Display
Abstract Digital Interface Over Black Background
Concept of Financial Data Analysis with Digital Elements
Explore More Free Stock Images