
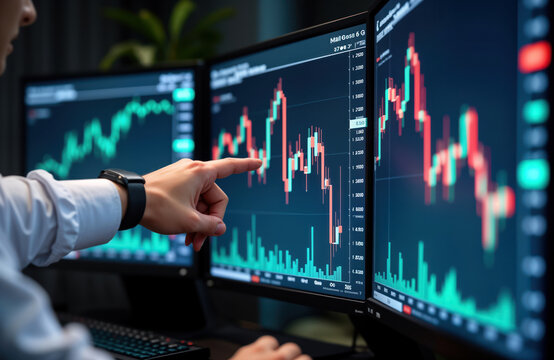
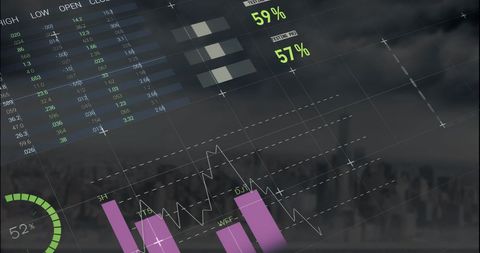
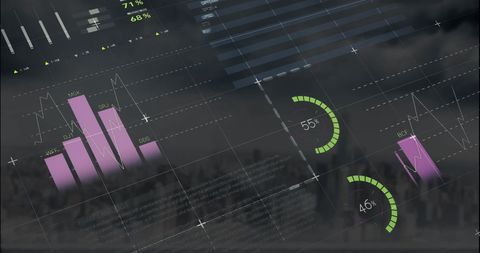
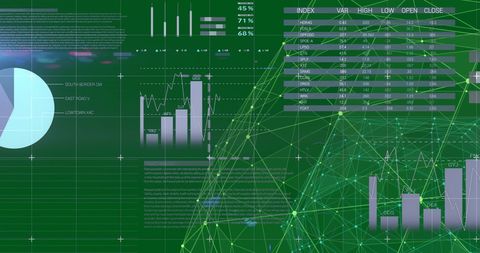
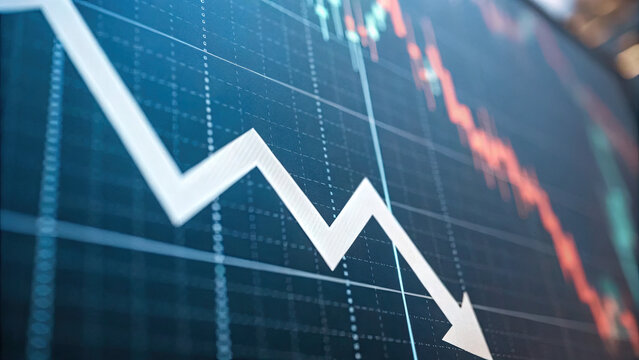
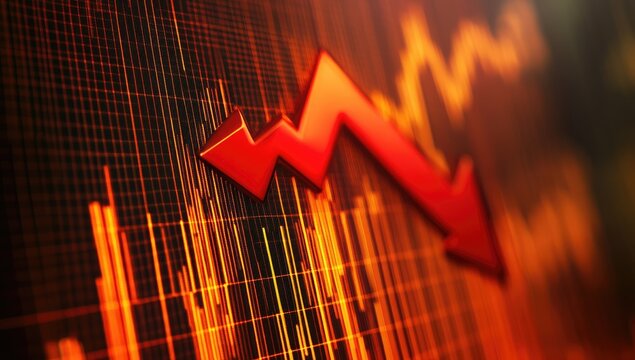
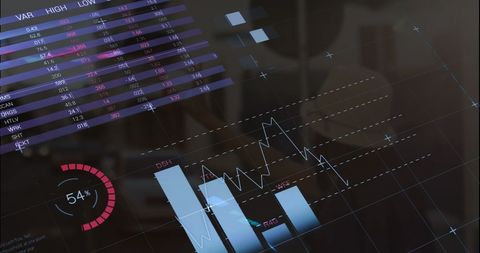
Financial Data Visualization with Interactive Graphs and Charts Image
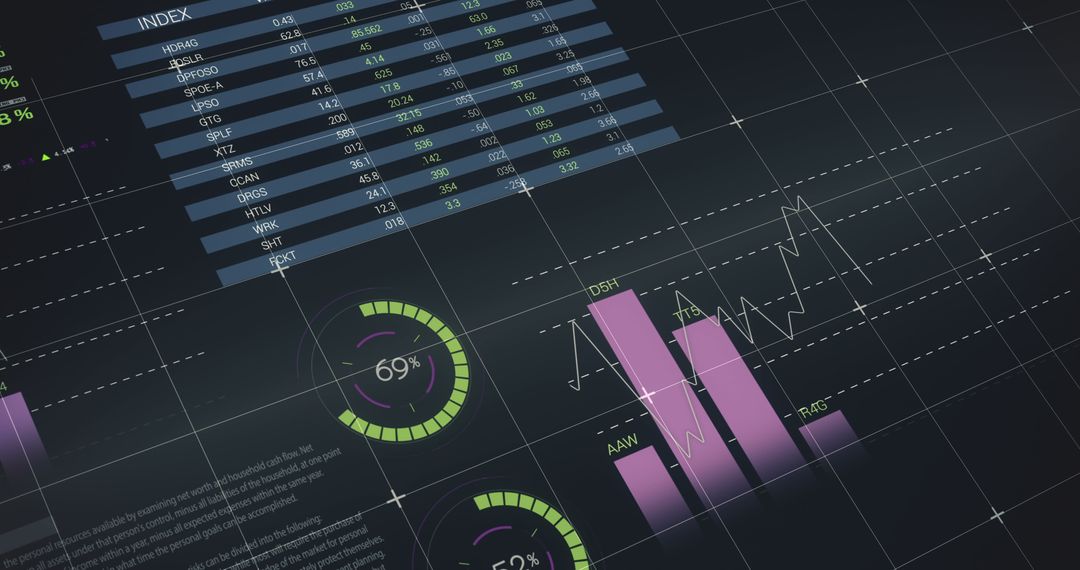
High-quality financial visualization with diverse charts and graphs detailing market trends. Useful for presentations, reports, or educational content about economic analysis and stock market data.
Powered by 


49
downloads
downloads
Credit Photo
If you would like to credit the Photo, here are some ways you can do so
Text Link
photo Link
<span class="text-link">
<span>
<a target="_blank" href=https://pikwizard.com/photo/financial-data-visualization-with-interactive-graphs-and-charts/2a238e117fc6b6e562b68ac5ce709d9c/>PikWizard</a>
</span>
</span>
<span class="image-link">
<span
style="margin: 0 0 20px 0; display: inline-block; vertical-align: middle; width: 100%;"
>
<a
target="_blank"
href="https://pikwizard.com/photo/financial-data-visualization-with-interactive-graphs-and-charts/2a238e117fc6b6e562b68ac5ce709d9c/"
style="text-decoration: none; font-size: 10px; margin: 0;"
>
<img src="https://pikwizard.com/pw/medium/2a238e117fc6b6e562b68ac5ce709d9c.jpg" style="margin: 0; width: 100%;" alt="" />
<p style="font-size: 12px; margin: 0;">PikWizard</p>
</a>
</span>
</span>
Free (free of charge)
Free for personal and commercial use.
Author: Authentic Images
Similar Images
Premium


Premium


Premium

Premium


Premium


Premium


Premium

Premium


Premium


Premium


Premium

Premium


Premium


Premium


Premium

Premium


Premium

Premium
Premium


Premium


Premium


Premium


Premium


Premium


Premium