
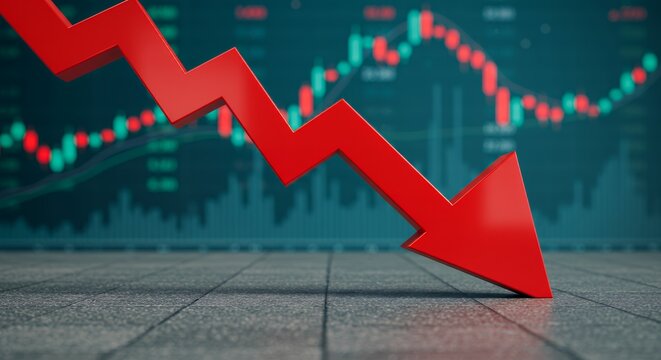
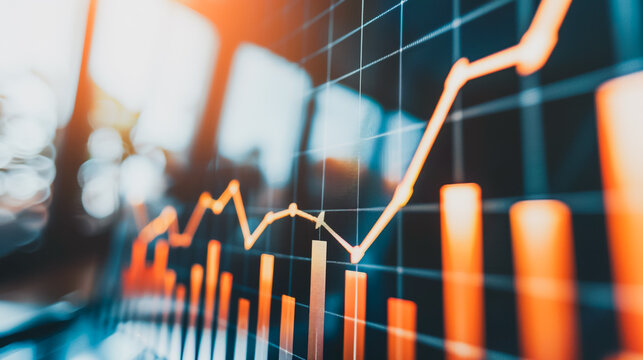
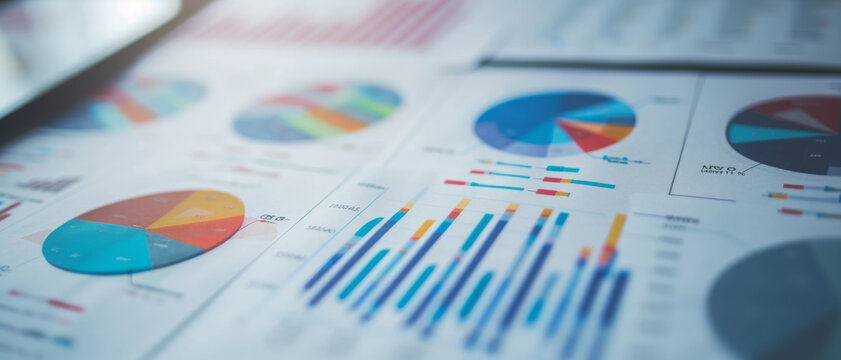
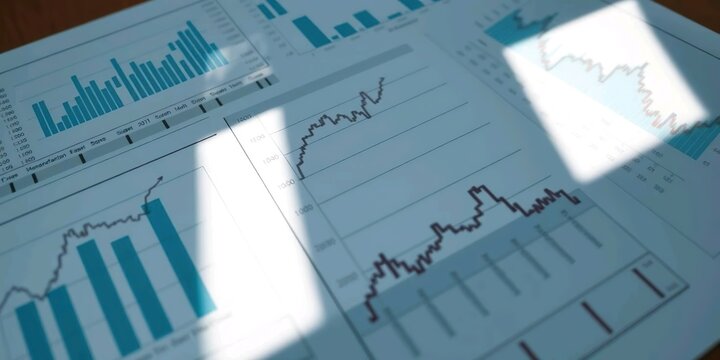
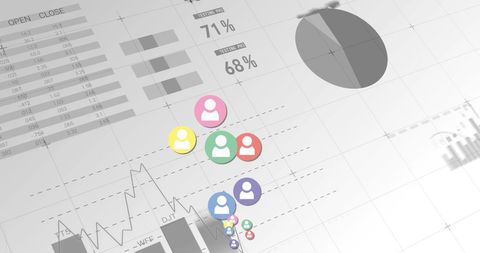
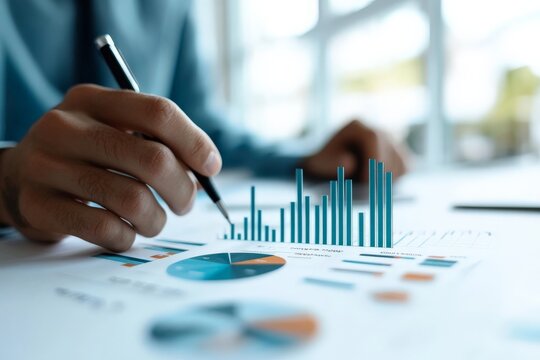
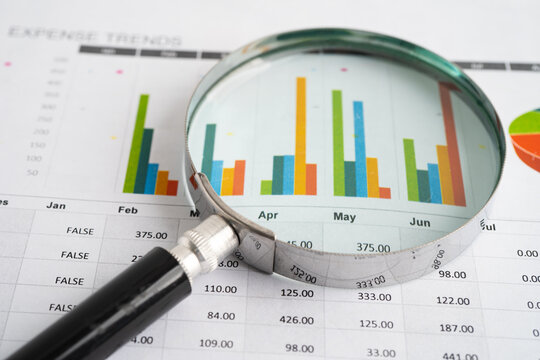
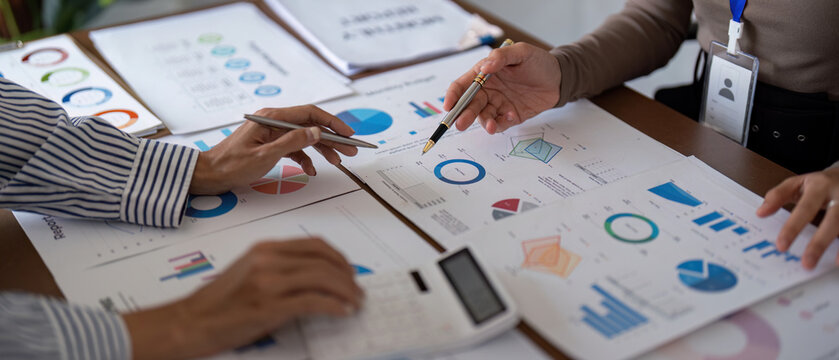
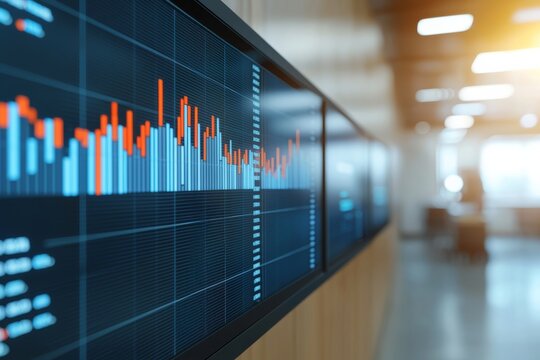
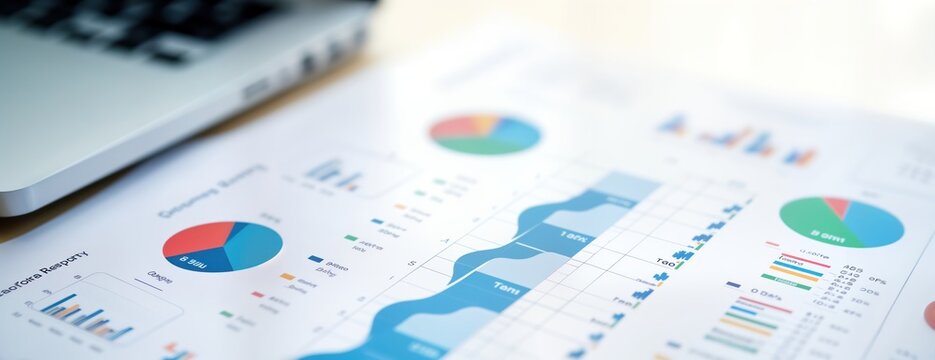
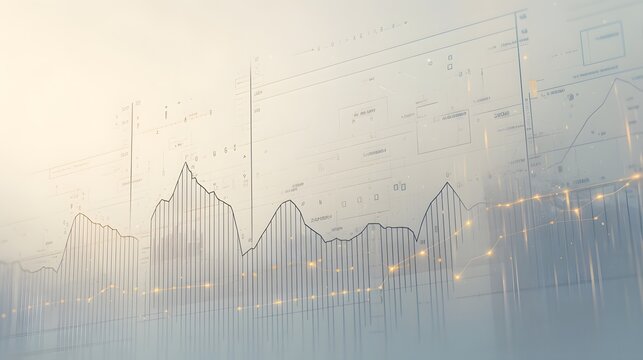
Business Data Analysis Fintech Statistics Charts Image
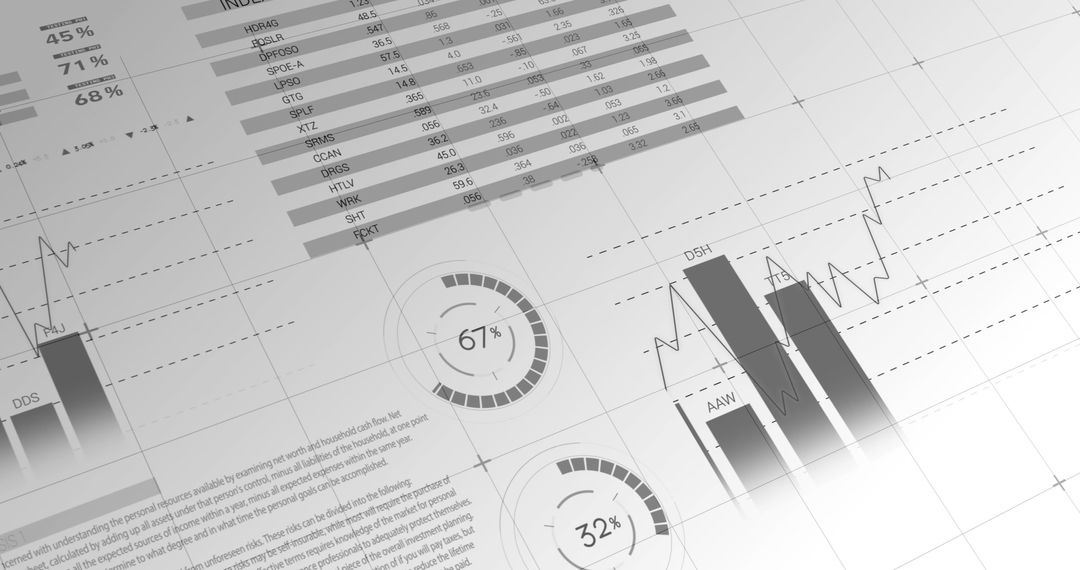
Various detailed financial charts displayed in a professional, polished layout crucial for presenting business data and analytics. Suitable for backgrounds, business slides, financial report covers, corporate presentations, and online articles on fintech and economic trends.
Powered by 


40
downloads
downloads
Credit Photo
If you would like to credit the Photo, here are some ways you can do so
Text Link
photo Link
<span class="text-link">
<span>
<a target="_blank" href=https://pikwizard.com/photo/business-data-analysis-fintech-statistics-charts/91f59e3ed4c9ef64817900eb1c47ead1/>PikWizard</a>
</span>
</span>
<span class="image-link">
<span
style="margin: 0 0 20px 0; display: inline-block; vertical-align: middle; width: 100%;"
>
<a
target="_blank"
href="https://pikwizard.com/photo/business-data-analysis-fintech-statistics-charts/91f59e3ed4c9ef64817900eb1c47ead1/"
style="text-decoration: none; font-size: 10px; margin: 0;"
>
<img src="https://pikwizard.com/pw/medium/91f59e3ed4c9ef64817900eb1c47ead1.jpg" style="margin: 0; width: 100%;" alt="" />
<p style="font-size: 12px; margin: 0;">PikWizard</p>
</a>
</span>
</span>
Free (free of charge)
Free for personal and commercial use.
Author: Authentic Images
Similar Images


Premium


Premium


Premium


Premium


Premium


Premium

Premium
Premium
Premium


Premium

Premium
Premium
Premium


Premium


Premium


Premium


Premium


Premium


Premium


Premium


Premium


Premium


Premium
Premium


Premium