- Home >
- Stock Photos >
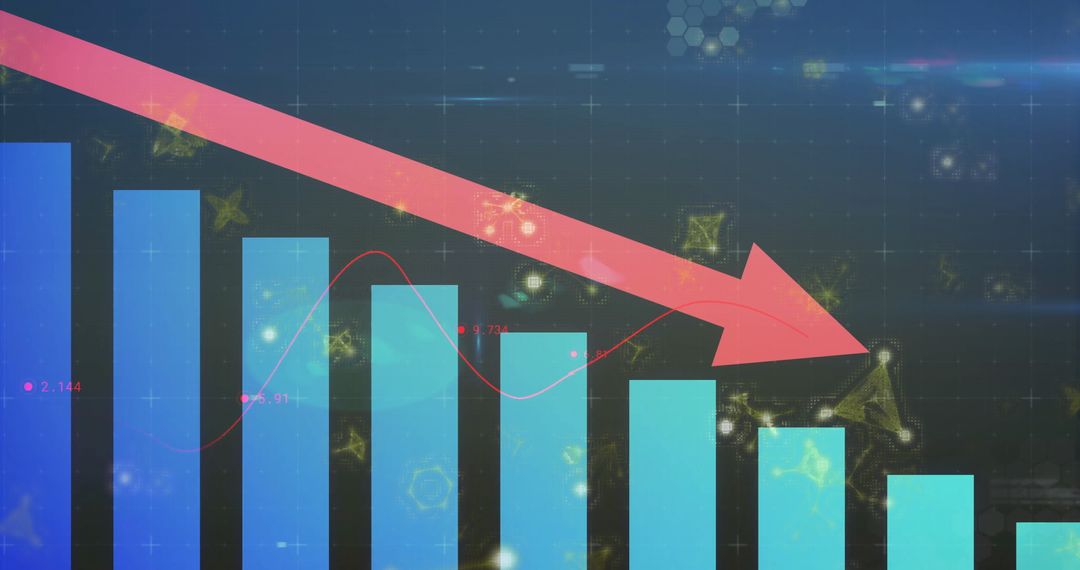
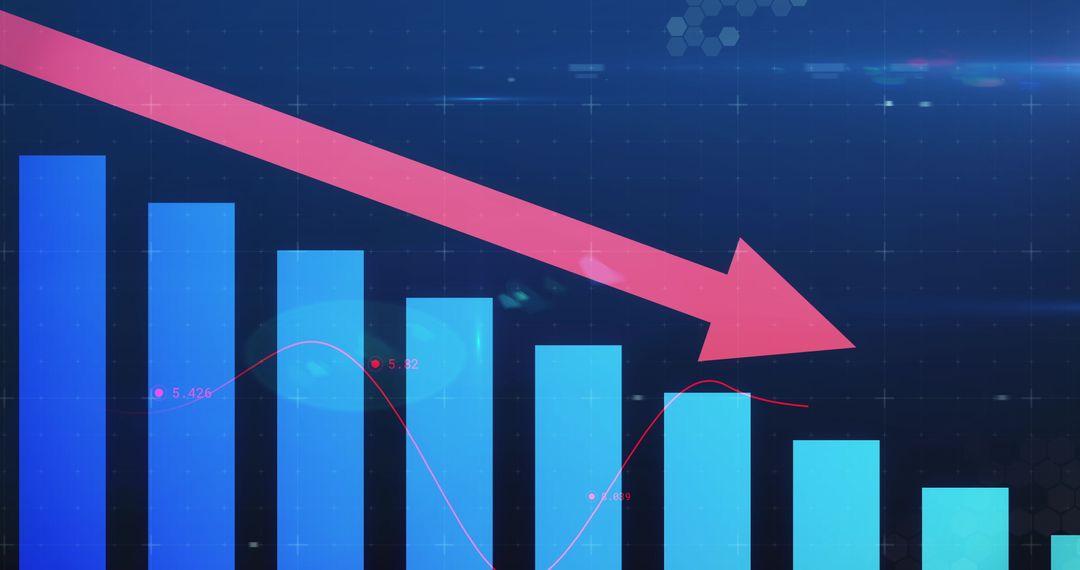
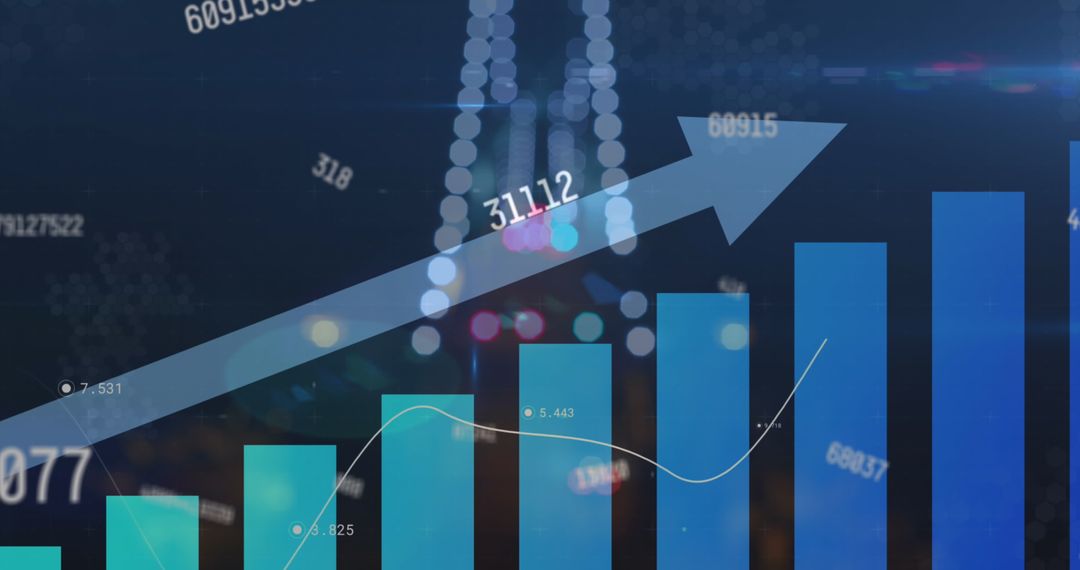
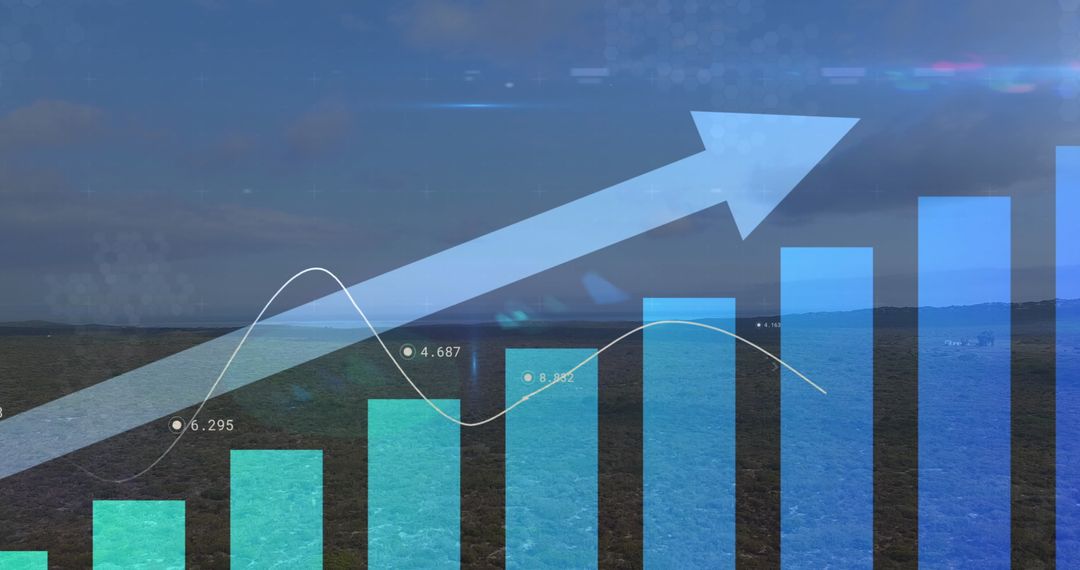
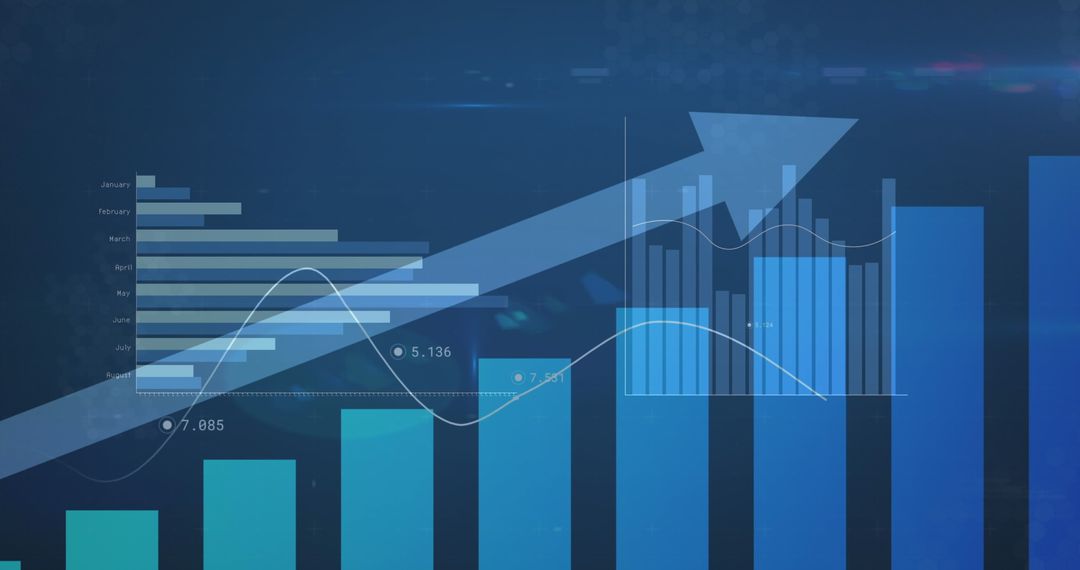
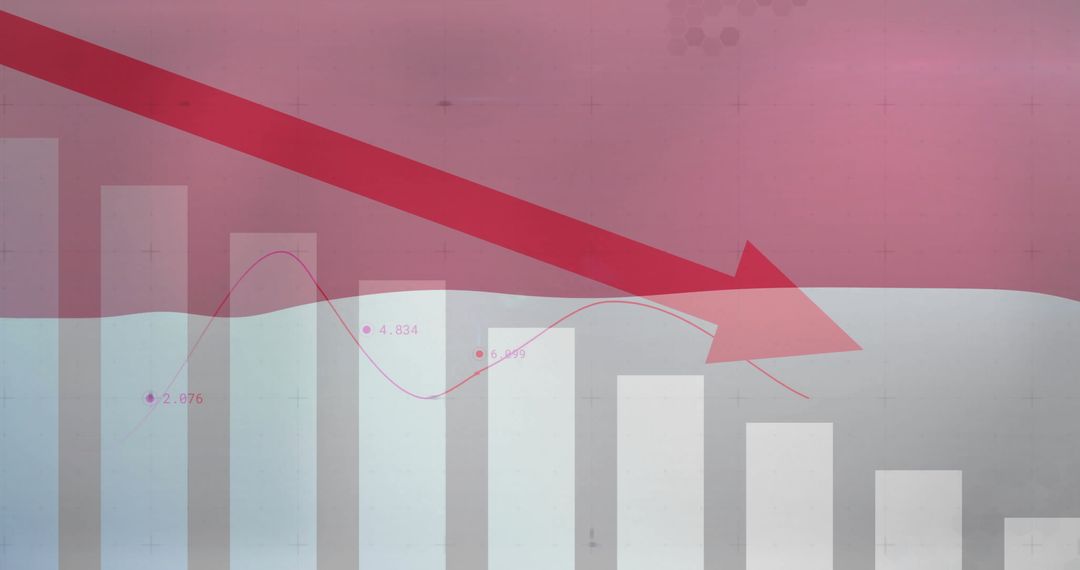
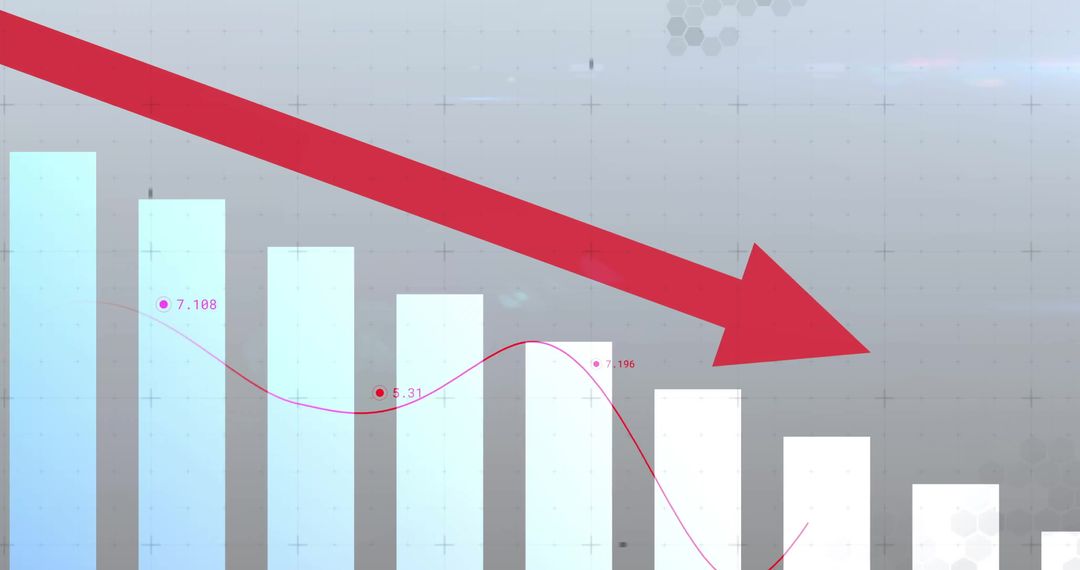
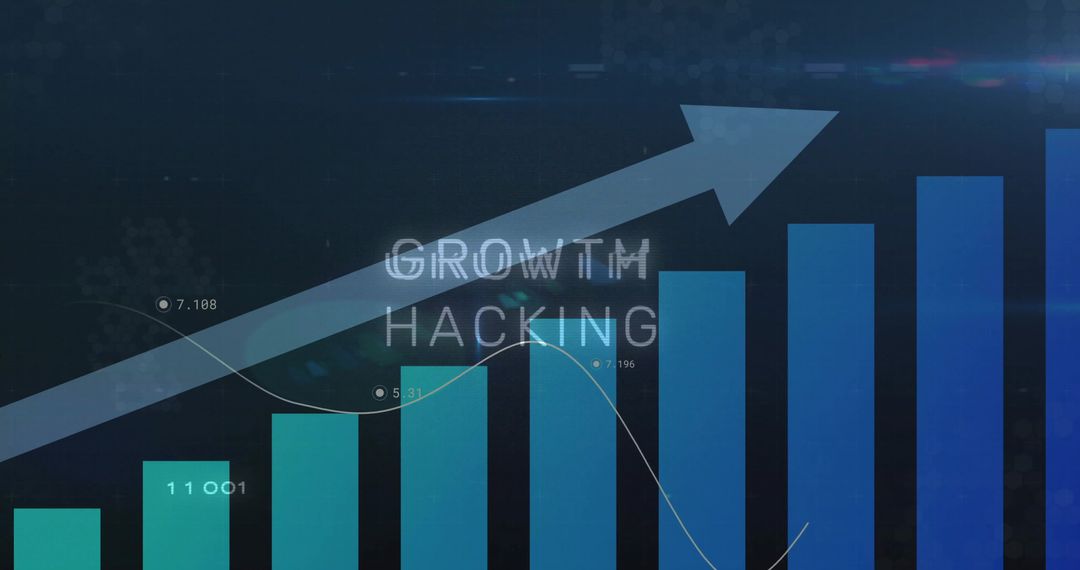
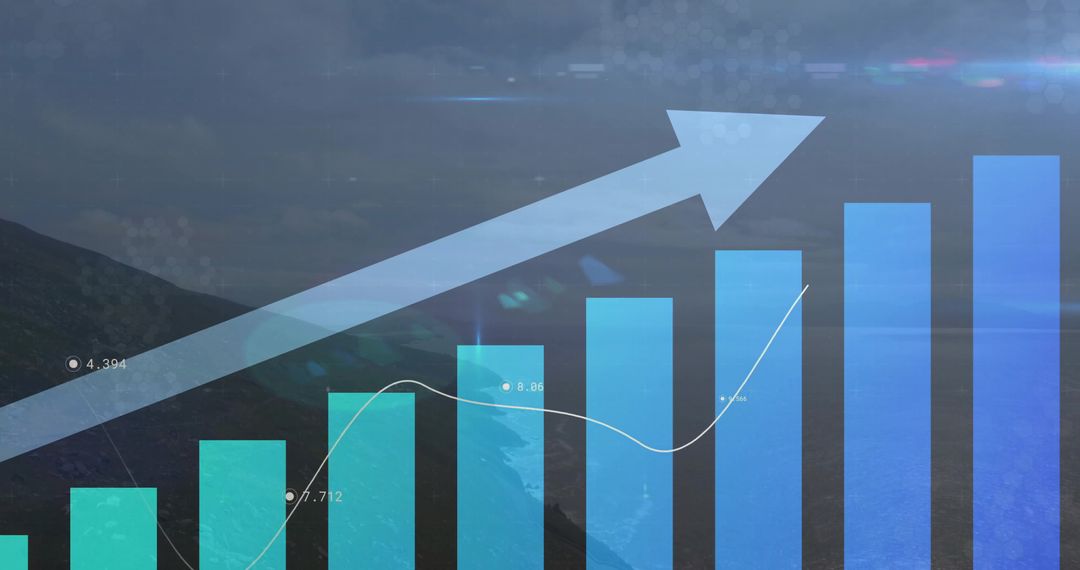
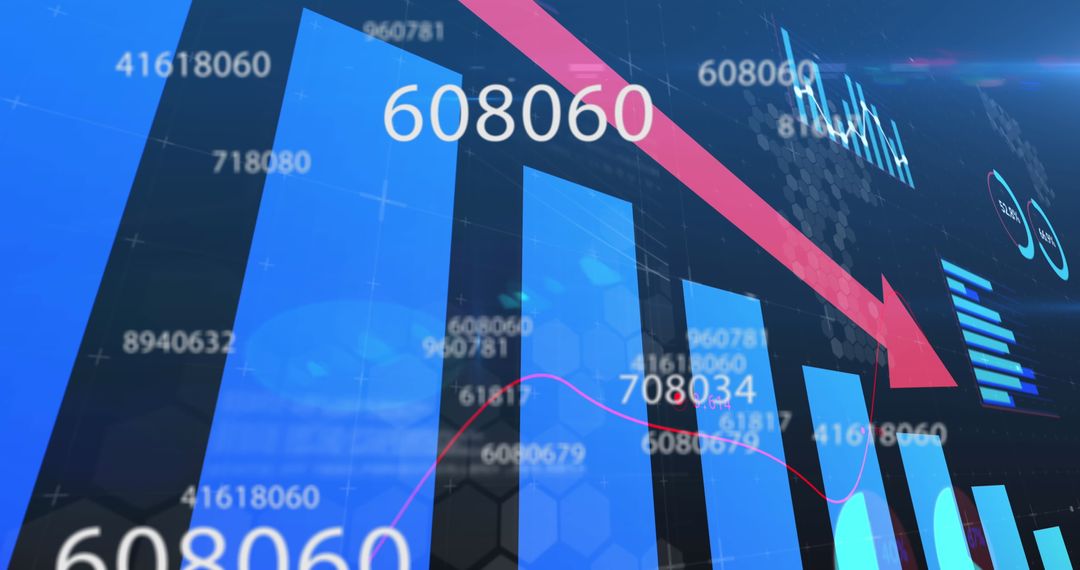
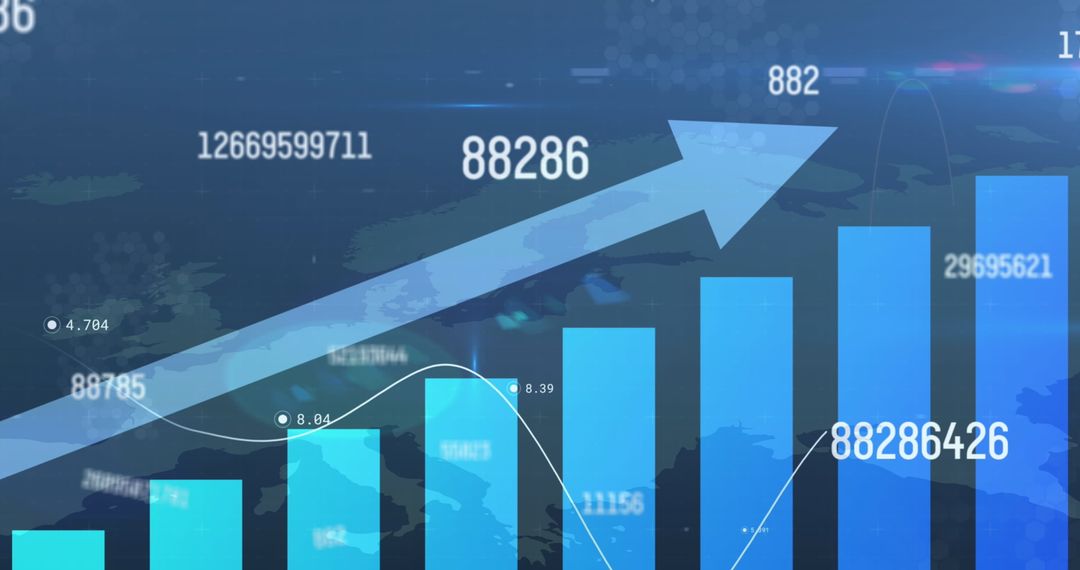
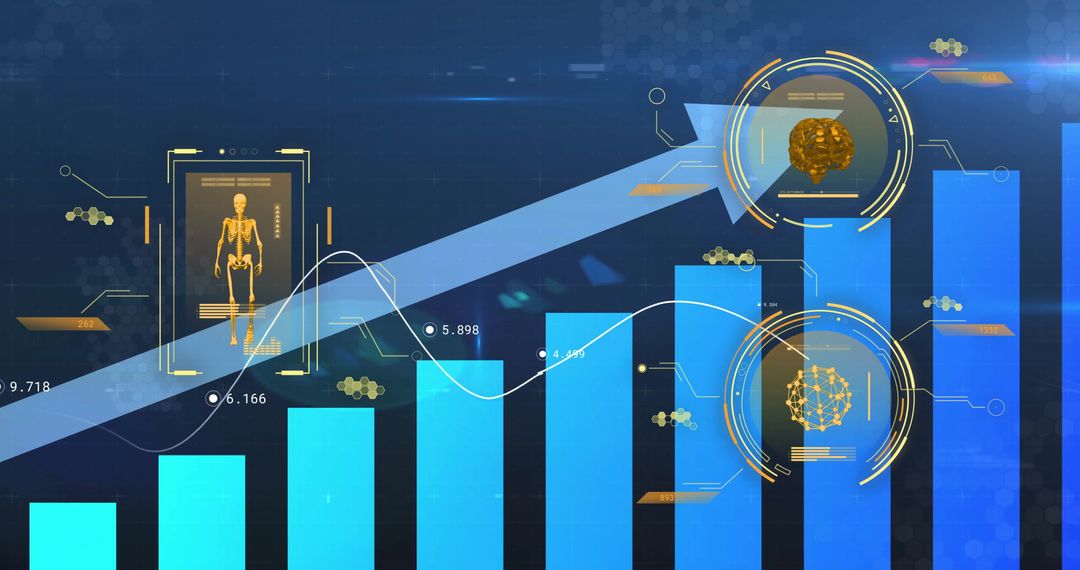
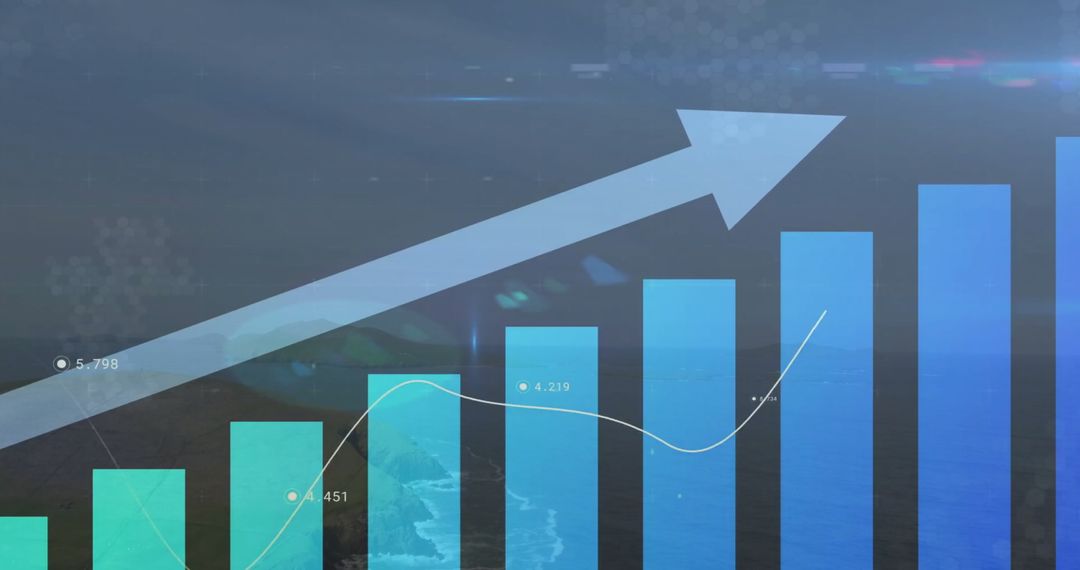
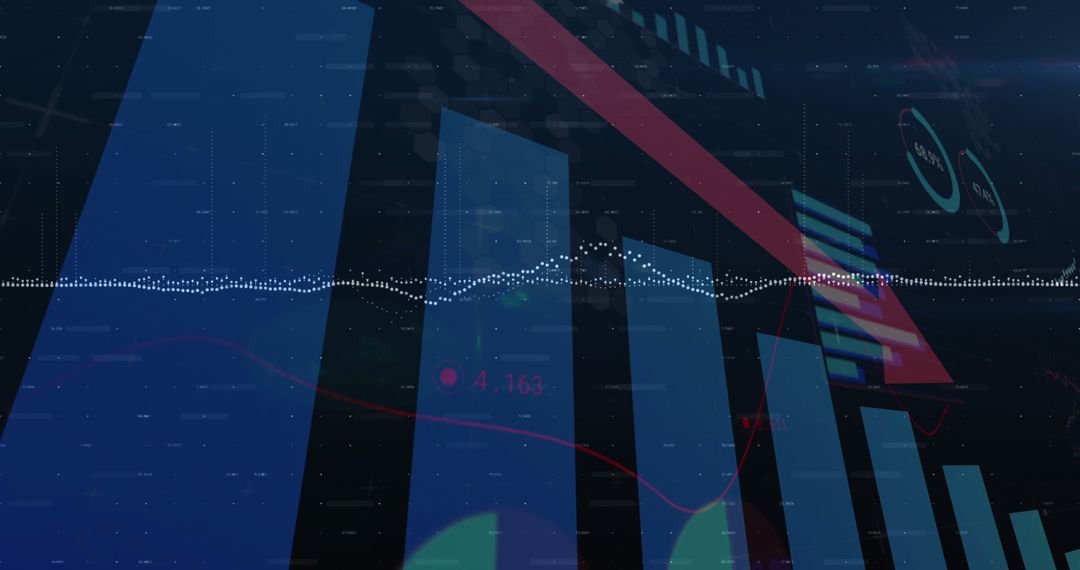
- Digital Composite with Bar Graph and Upward Arrow Indicator
Digital Composite with Bar Graph and Upward Arrow Indicator Image
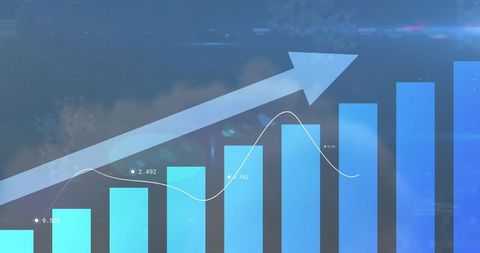
Visualizing data trends with bar graph and upward arrows is ideal for showcasing business growth, projecting financial gains, or emphasizing technological advancements. Useful for digital presentations, investment pitches, or analytical reports invoking a sense of progress and future outlooks.
Powered by  - Get 15% off with code: PIKWIZARD15


0
downloads
downloads
Tags:
More
Credit Photo
If you would like to credit the Photo, here are some ways you can do so
Text Link
photo Link
<span class="text-link">
<span>
<a target="_blank" href=https://pikwizard.com/photo/digital-composite-with-bar-graph-and-upward-arrow-indicator/e6d1f95637df297702064a4bc1efc18b/>PikWizard</a>
</span>
</span>
<span class="image-link">
<span
style="margin: 0 0 20px 0; display: inline-block; vertical-align: middle; width: 100%;"
>
<a
target="_blank"
href="https://pikwizard.com/photo/digital-composite-with-bar-graph-and-upward-arrow-indicator/e6d1f95637df297702064a4bc1efc18b/"
style="text-decoration: none; font-size: 10px; margin: 0;"
>
<img src="https://pikwizard.com/pw/medium/e6d1f95637df297702064a4bc1efc18b.jpg" style="margin: 0; width: 100%;" alt="" />
<p style="font-size: 12px; margin: 0;">PikWizard</p>
</a>
</span>
</span>
Free (free of charge)
Free for personal and commercial use.
Author: Authentic Images
Similar Free Stock Images

Premium


Premium


Premium


Premium


Premium


Premium


Premium


Premium


Premium


Premium


Premium


Premium


Premium


Premium


Premium


Premium


Premium


Premium


Premium


Premium


Premium


Premium


Premium

Premium