- Home >
- Stock Photos >
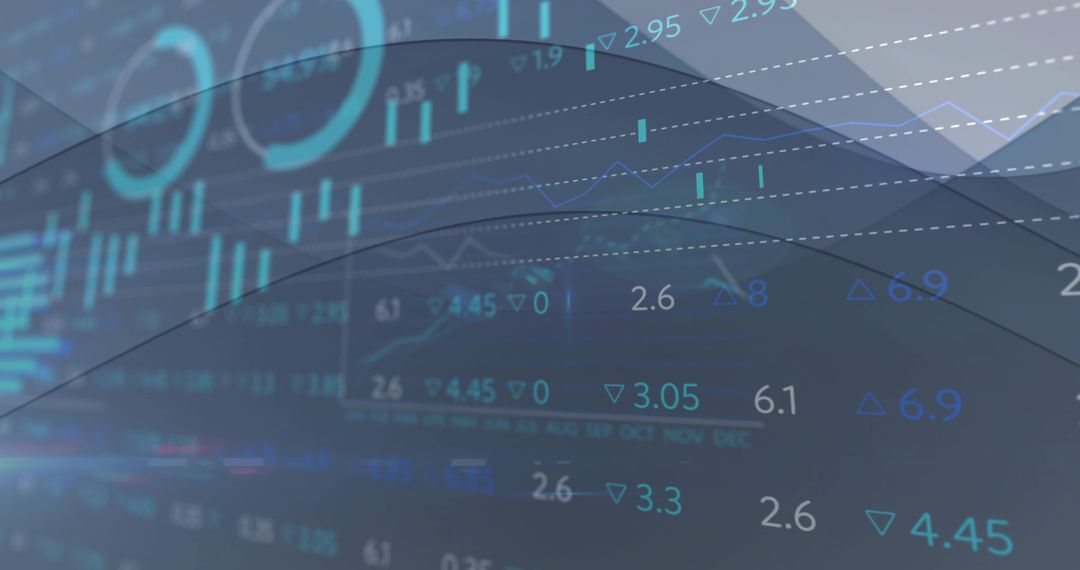
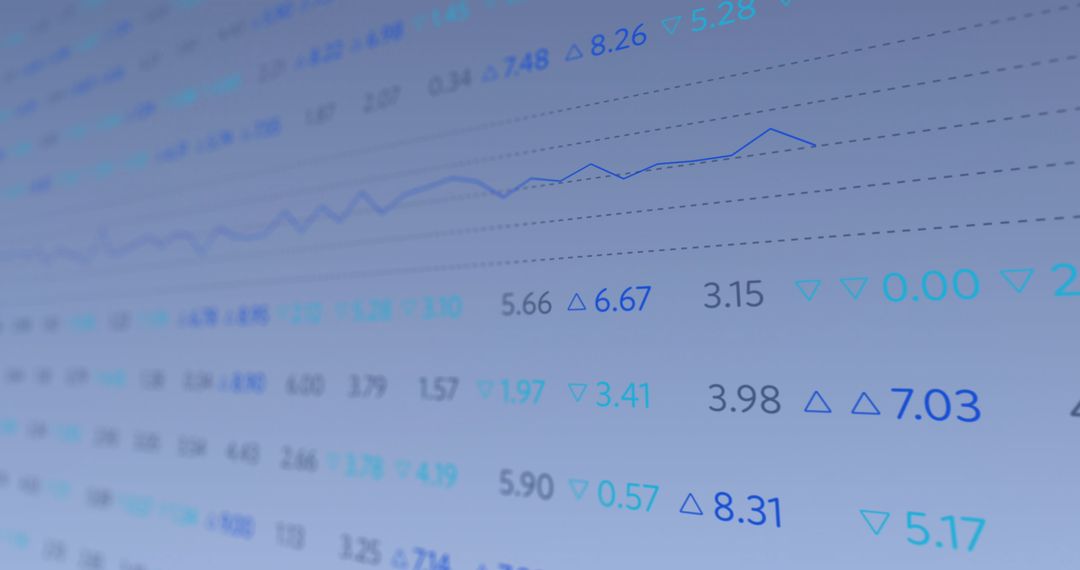
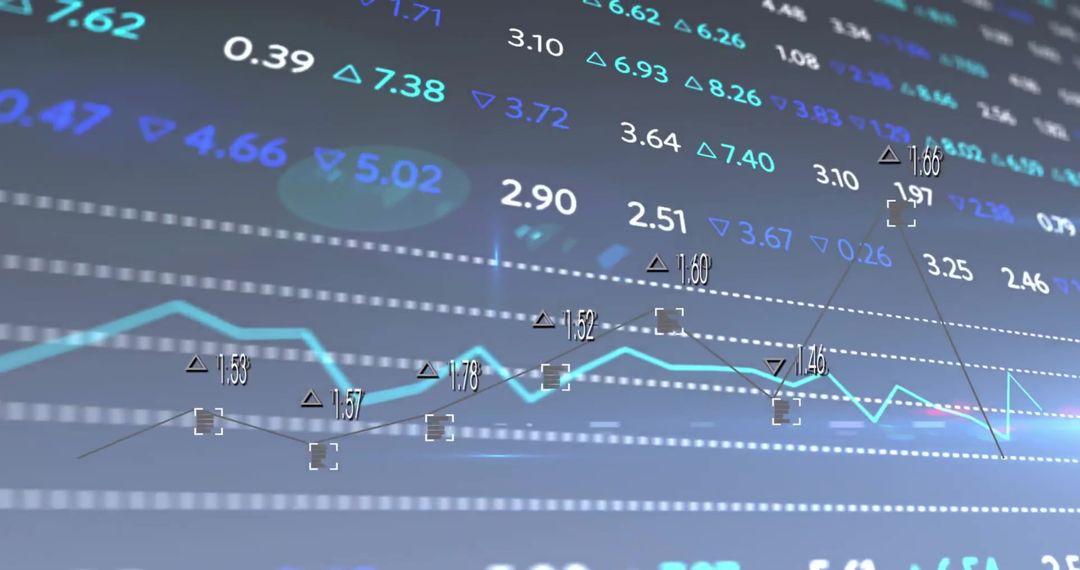
- Digital Concept of Advanced Data Visualizations in Technology
Digital Concept of Advanced Data Visualizations in Technology Image

This depiction shows a technological concept with floating numbers and geometric shapes, often used to represent analytics, data visualization, and financial cell indices. Vision suitable for presentations or articles about data analytics advancements, and technological innovations can contextualize high-tech files or web tools publicity, particularly useful for reports on digital dashboards or technological stocks transformations.
Powered by  - Get 15% off with code: PIKWIZARD15


0
downloads
downloads
Tags:
More
Credit Photo
If you would like to credit the Photo, here are some ways you can do so
Text Link
photo Link
<span class="text-link">
<span>
<a target="_blank" href=https://pikwizard.com/photo/digital-concept-of-advanced-data-visualizations-in-technology/20cb6c6bc412b87886f6443d31d9bd45/>PikWizard</a>
</span>
</span>
<span class="image-link">
<span
style="margin: 0 0 20px 0; display: inline-block; vertical-align: middle; width: 100%;"
>
<a
target="_blank"
href="https://pikwizard.com/photo/digital-concept-of-advanced-data-visualizations-in-technology/20cb6c6bc412b87886f6443d31d9bd45/"
style="text-decoration: none; font-size: 10px; margin: 0;"
>
<img src="https://pikwizard.com/pw/medium/20cb6c6bc412b87886f6443d31d9bd45.jpg" style="margin: 0; width: 100%;" alt="" />
<p style="font-size: 12px; margin: 0;">PikWizard</p>
</a>
</span>
</span>
Free (free of charge)
Free for personal and commercial use.
Author: Creative Art
Similar Free Stock Images

Premium


Premium


Premium


Premium


Premium


Premium


Premium


Premium


Premium


Premium


Premium


Premium


Premium


Premium


Premium


Premium


Premium


Premium


Premium


Premium


Premium


Premium


Premium


Premium