- Home >
- Stock Photos >
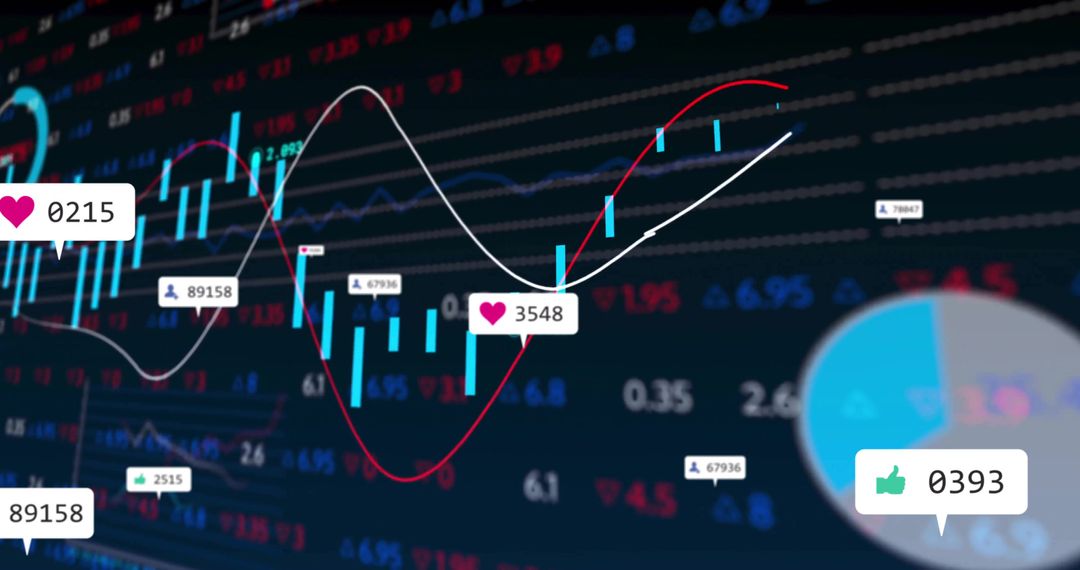
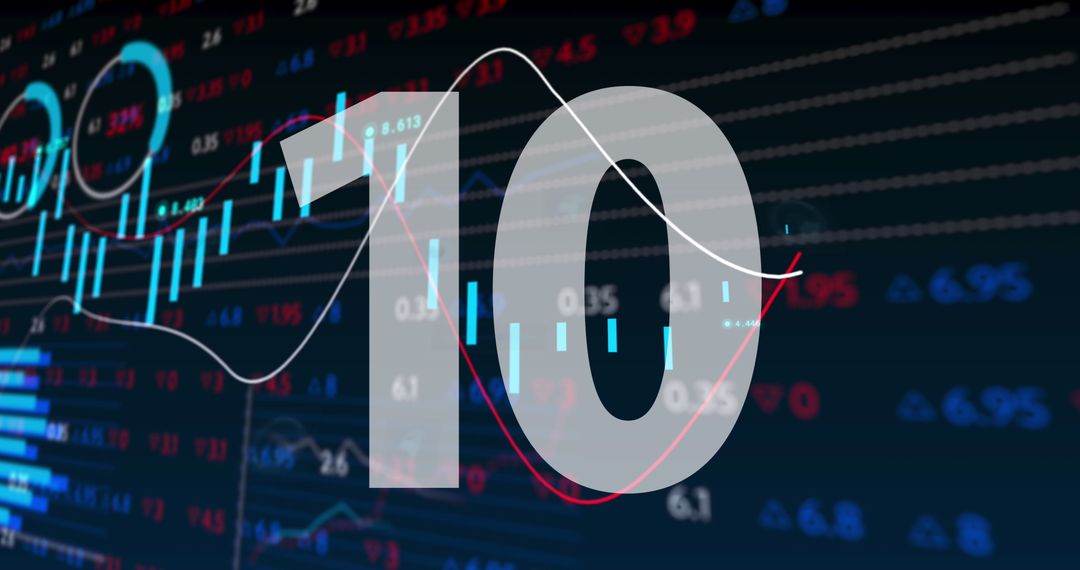
- Digital Countdown Overlapping Global Stock Market Charts
Digital Countdown Overlapping Global Stock Market Charts Image

This impactful image combines a dynamic digital countdown with the dramatic rise and fall of global stock market data charts on a blue background. The overlapping numbers add a sense of urgency and movement to the complex lines and fluctuating values in red and blue. It is ideal for use in financial reports, presentations on market analysis, and resources focused on the global economy and technological innovations in finance.
Powered by  - Get 15% off with code: PIKWIZARD15


2
downloads
downloads
Tags:
More
Credit Photo
If you would like to credit the Photo, here are some ways you can do so
Text Link
photo Link
<span class="text-link">
<span>
<a target="_blank" href=https://pikwizard.com/photo/digital-countdown-overlapping-global-stock-market-charts/e4a1a86665468aef5bcc0da858d5e907/>PikWizard</a>
</span>
</span>
<span class="image-link">
<span
style="margin: 0 0 20px 0; display: inline-block; vertical-align: middle; width: 100%;"
>
<a
target="_blank"
href="https://pikwizard.com/photo/digital-countdown-overlapping-global-stock-market-charts/e4a1a86665468aef5bcc0da858d5e907/"
style="text-decoration: none; font-size: 10px; margin: 0;"
>
<img src="https://pikwizard.com/pw/medium/e4a1a86665468aef5bcc0da858d5e907.jpg" style="margin: 0; width: 100%;" alt="" />
<p style="font-size: 12px; margin: 0;">PikWizard</p>
</a>
</span>
</span>
Free (free of charge)
Free for personal and commercial use.
Author: Awesome Content
Similar Free Stock Images
Premium


Premium


Premium


Premium


Premium


Premium


Premium


Premium


Premium


Premium


Premium


Premium


Premium


Premium


Premium


Premium


Premium


Premium


Premium


Premium


Premium


Premium


Premium


Premium