- Home >
- Stock Photos >
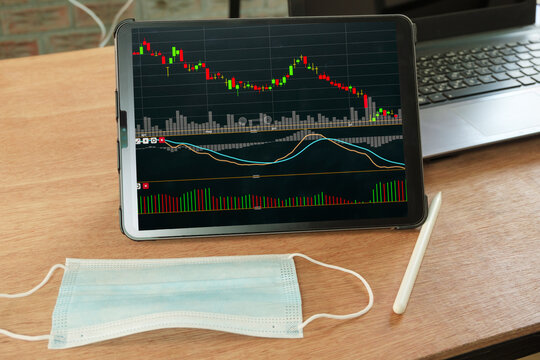
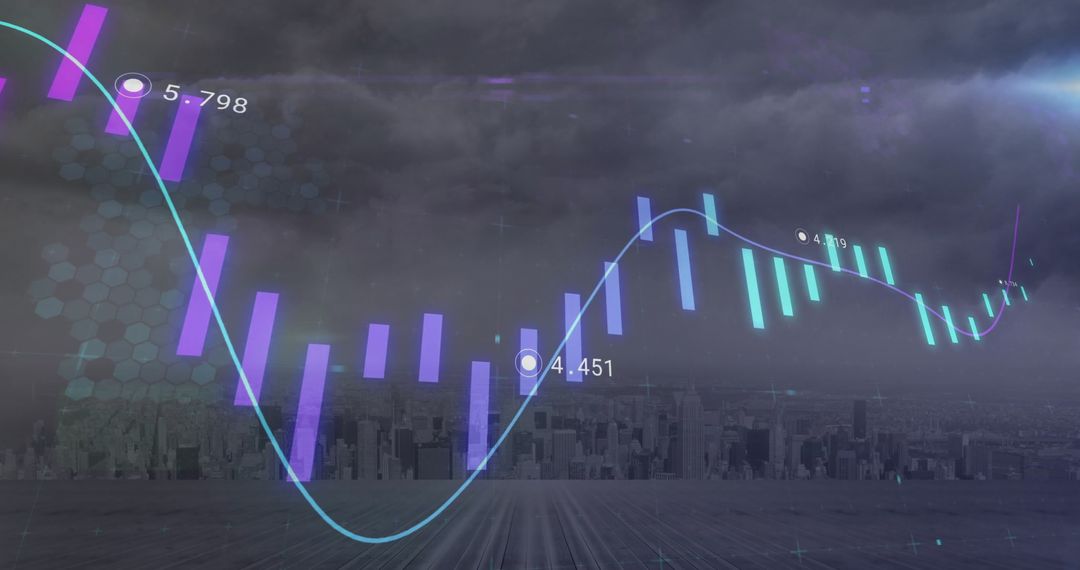
- Digital COVID-19 Data With Graphs and Charts
Digital COVID-19 Data With Graphs and Charts Image

Graphic showing digital representation of COVID-19 data with graphs and statistical analysis. Could be used for news reports, educational purposes, data analysis reviews, and pandemic impact studies. Ideal for illustrating complex scientific and technological topics related to the global pandemic.
Powered by 


0
downloads
downloads
Tags:
More
Credit Photo
If you would like to credit the Photo, here are some ways you can do so
Text Link
photo Link
<span class="text-link">
<span>
<a target="_blank" href=https://pikwizard.com/photo/digital-covid-19-data-with-graphs-and-charts/59cc6ab882f23bad5320519682d61491/>PikWizard</a>
</span>
</span>
<span class="image-link">
<span
style="margin: 0 0 20px 0; display: inline-block; vertical-align: middle; width: 100%;"
>
<a
target="_blank"
href="https://pikwizard.com/photo/digital-covid-19-data-with-graphs-and-charts/59cc6ab882f23bad5320519682d61491/"
style="text-decoration: none; font-size: 10px; margin: 0;"
>
<img src="https://pikwizard.com/pw/medium/59cc6ab882f23bad5320519682d61491.jpg" style="margin: 0; width: 100%;" alt="" />
<p style="font-size: 12px; margin: 0;">PikWizard</p>
</a>
</span>
</span>
Free (free of charge)
Free for personal and commercial use.
Author: Authentic Images
Similar Free Stock Images

Premium


Premium


Premium


Premium


Premium


Premium


Premium


Premium


Premium


Premium


Premium


Premium


Premium


Premium


Premium


Premium


Premium


Premium


Premium


Premium


Premium


Premium


Premium


Premium