- Home >
- Stock Photos >
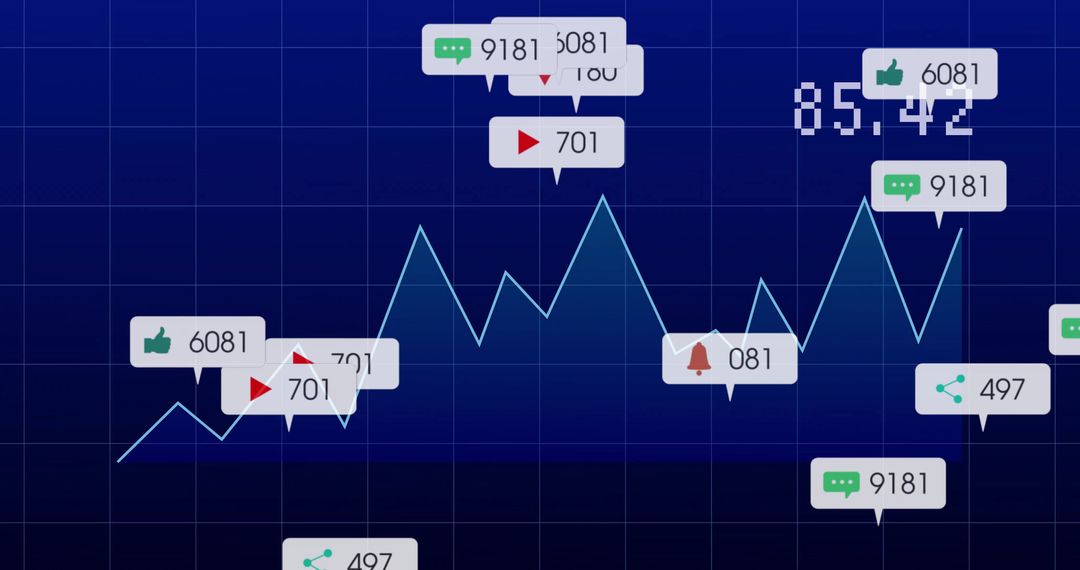
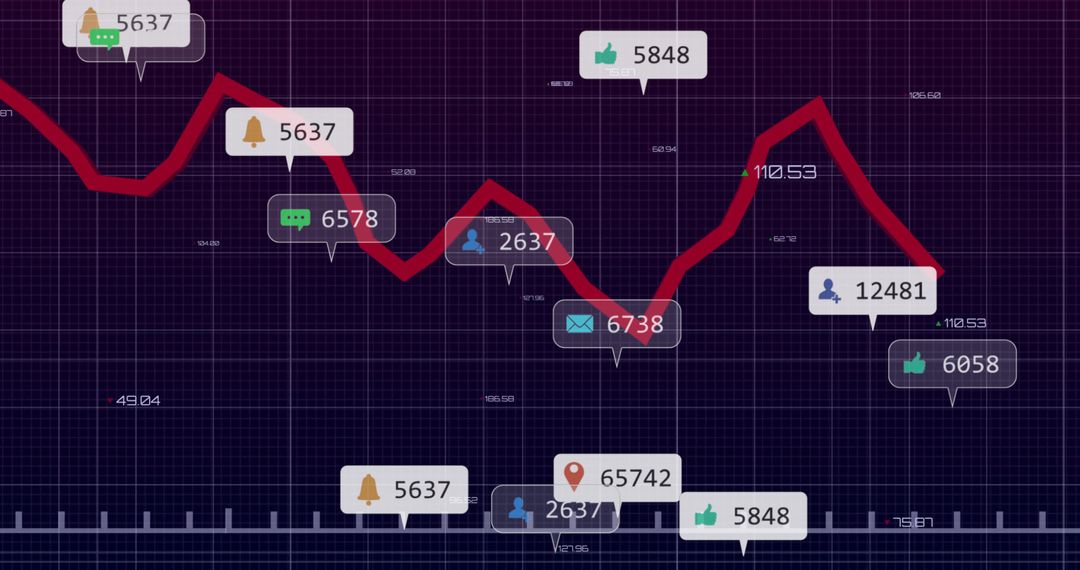
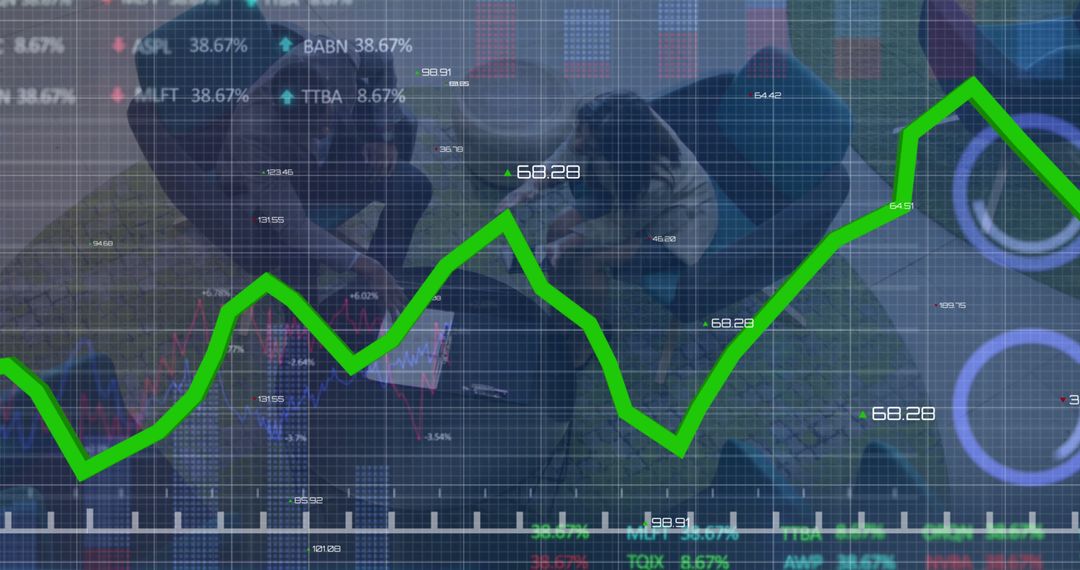
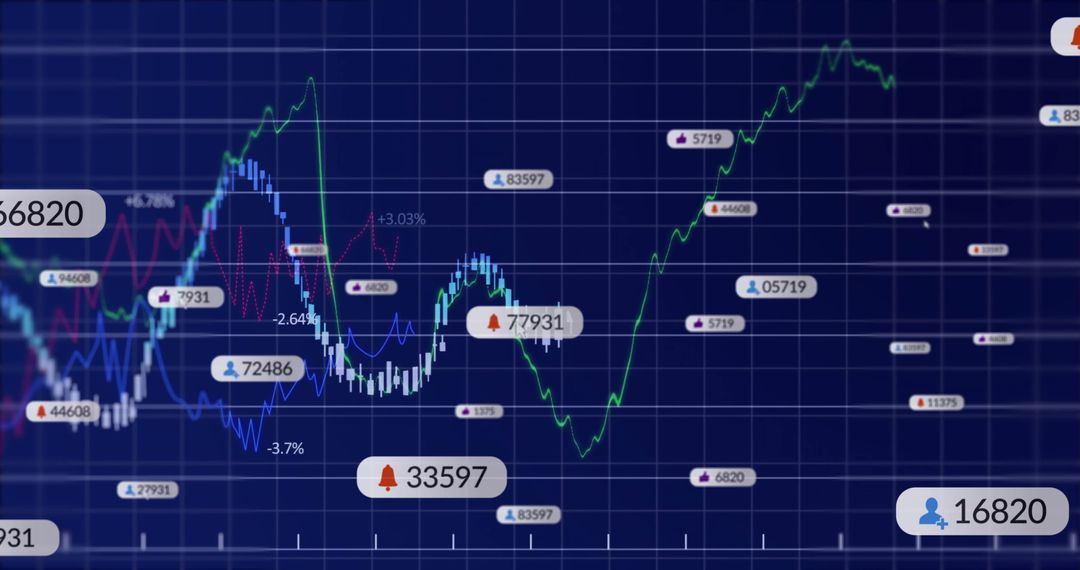
- Digital Dashboard Analytics Graphic Illustrating Trends
Digital Dashboard Analytics Graphic Illustrating Trends Image

Graphic features a red trend line depicting fluctuating digital metrics on a blue grid background. Text callouts with various shapes demonstrate real-time interactions and performance indicators. Useful for presentations, adding context to digital strategy discussions, communicating insights in business proposals, illustrating trends in social media metrics, and enhancing data-centered visuals in educational tools.
Powered by 


0
downloads
downloads
Tags:
More
Credit Photo
If you would like to credit the Photo, here are some ways you can do so
Text Link
photo Link
<span class="text-link">
<span>
<a target="_blank" href=https://pikwizard.com/photo/digital-dashboard-analytics-graphic-illustrating-trends/6d0add7acf444fc214c5e530135d655a/>PikWizard</a>
</span>
</span>
<span class="image-link">
<span
style="margin: 0 0 20px 0; display: inline-block; vertical-align: middle; width: 100%;"
>
<a
target="_blank"
href="https://pikwizard.com/photo/digital-dashboard-analytics-graphic-illustrating-trends/6d0add7acf444fc214c5e530135d655a/"
style="text-decoration: none; font-size: 10px; margin: 0;"
>
<img src="https://pikwizard.com/pw/medium/6d0add7acf444fc214c5e530135d655a.jpg" style="margin: 0; width: 100%;" alt="" />
<p style="font-size: 12px; margin: 0;">PikWizard</p>
</a>
</span>
</span>
Free (free of charge)
Free for personal and commercial use.
Author: People Creations
Similar Free Stock Images

Premium


Premium


Premium


Premium


Premium


Premium


Premium


Premium


Premium


Premium


Premium


Premium


Premium


Premium


Premium


Premium


Premium


Premium


Premium


Premium


Premium


Premium


Premium


Premium