- Home >
- Stock Photos >
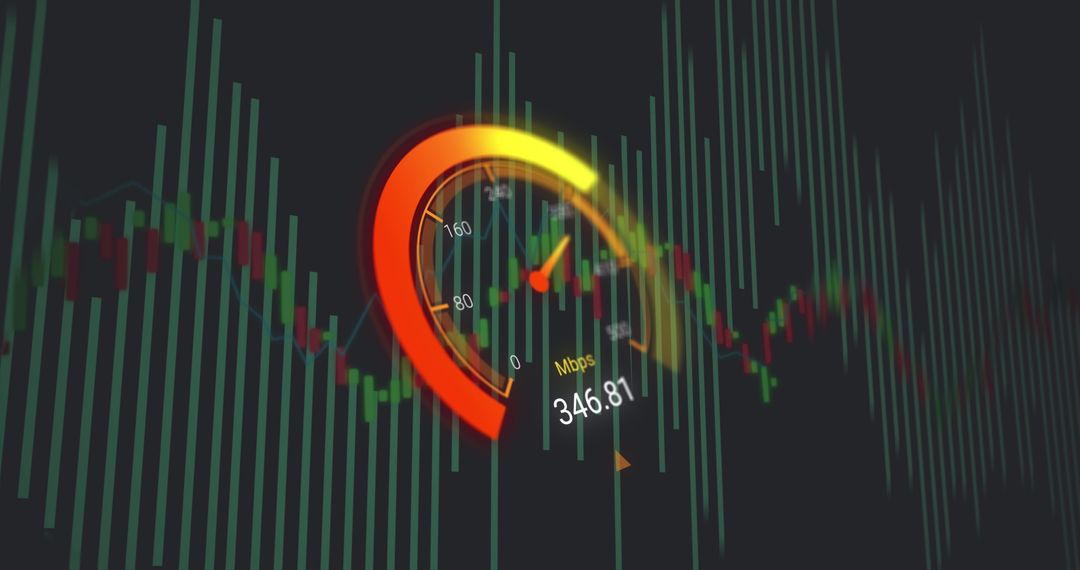
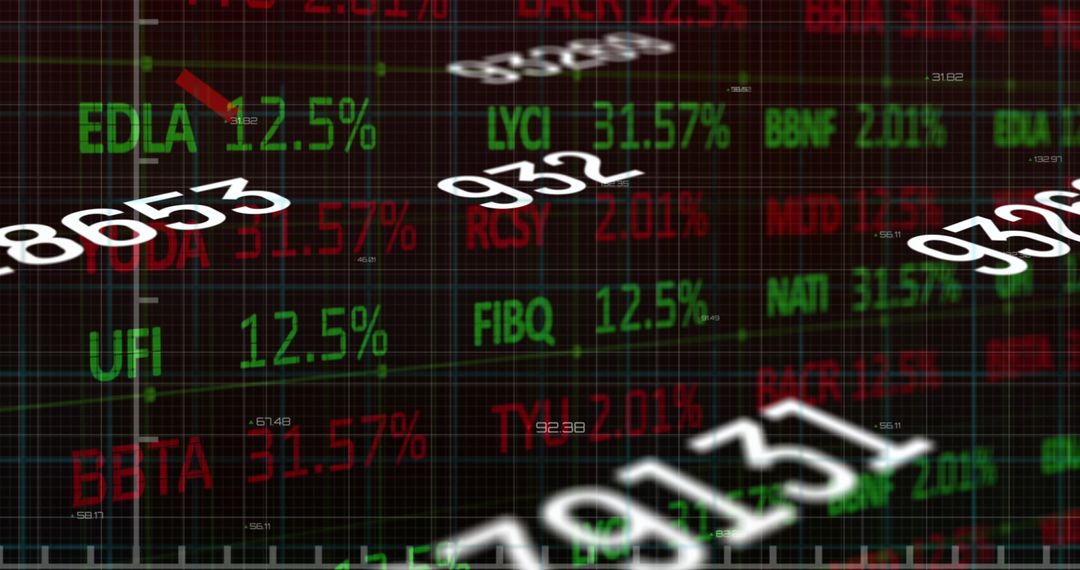
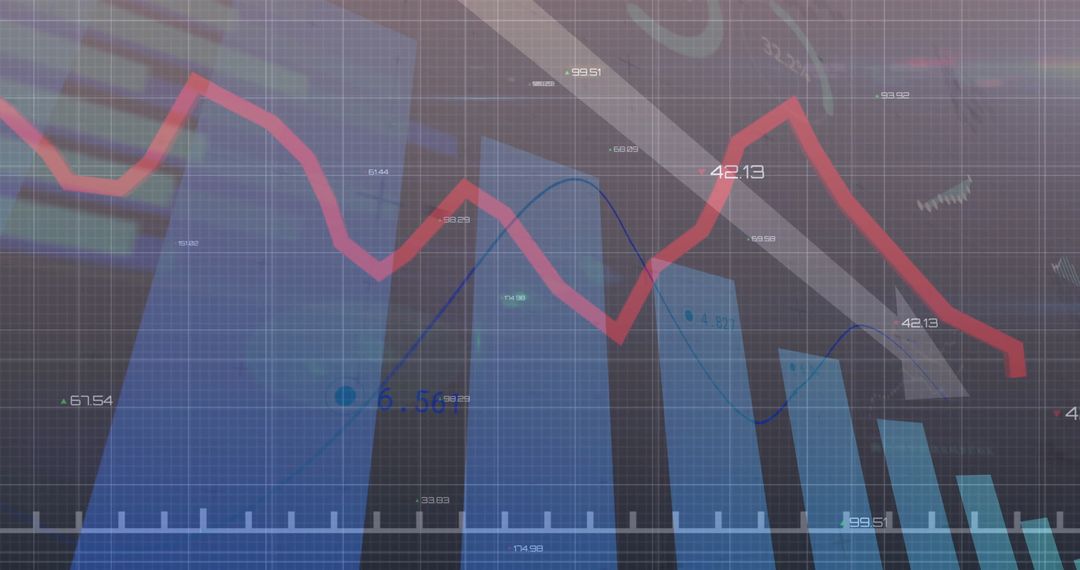
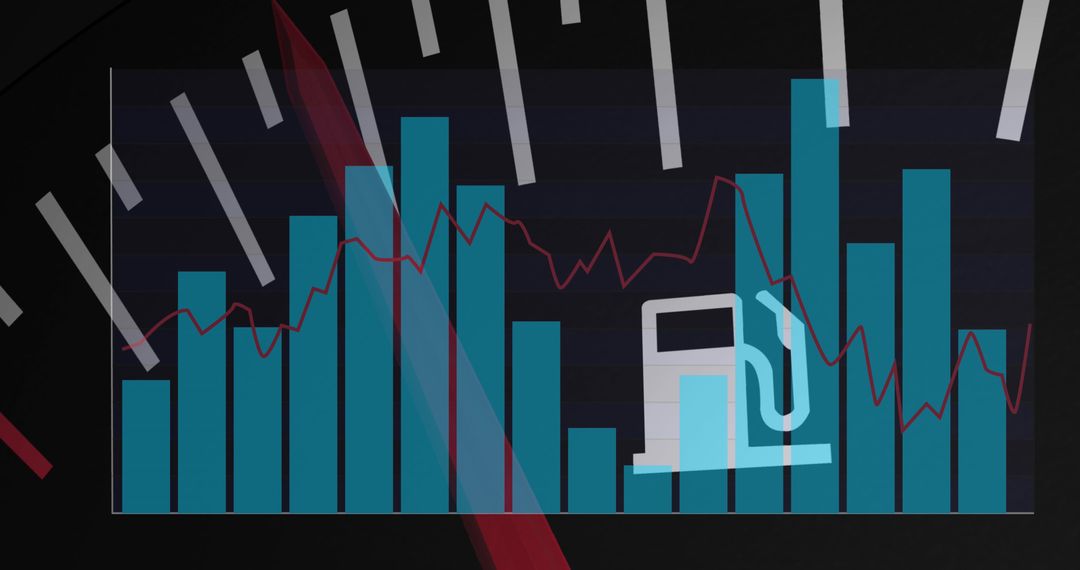
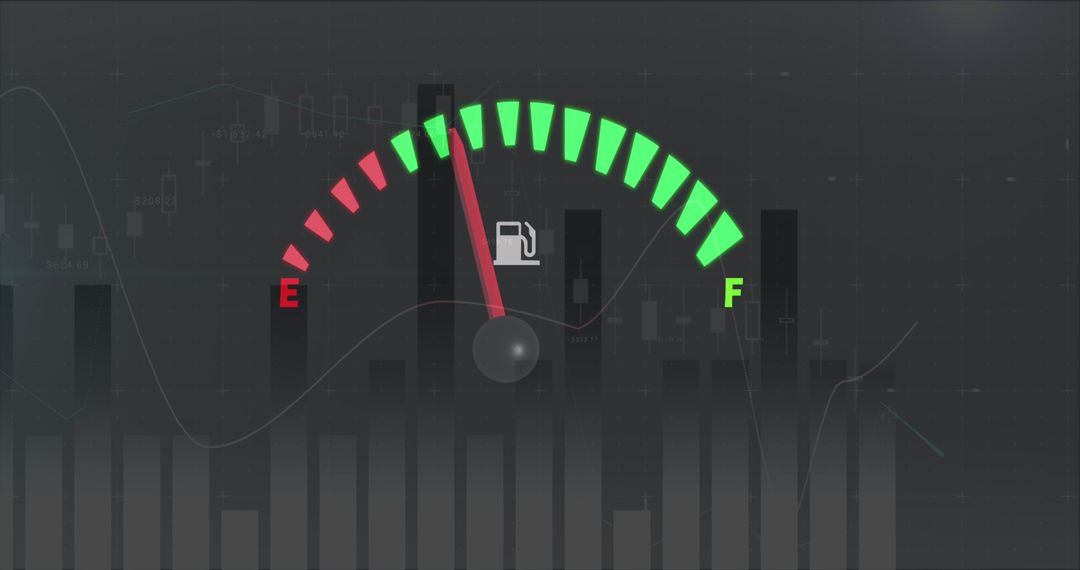
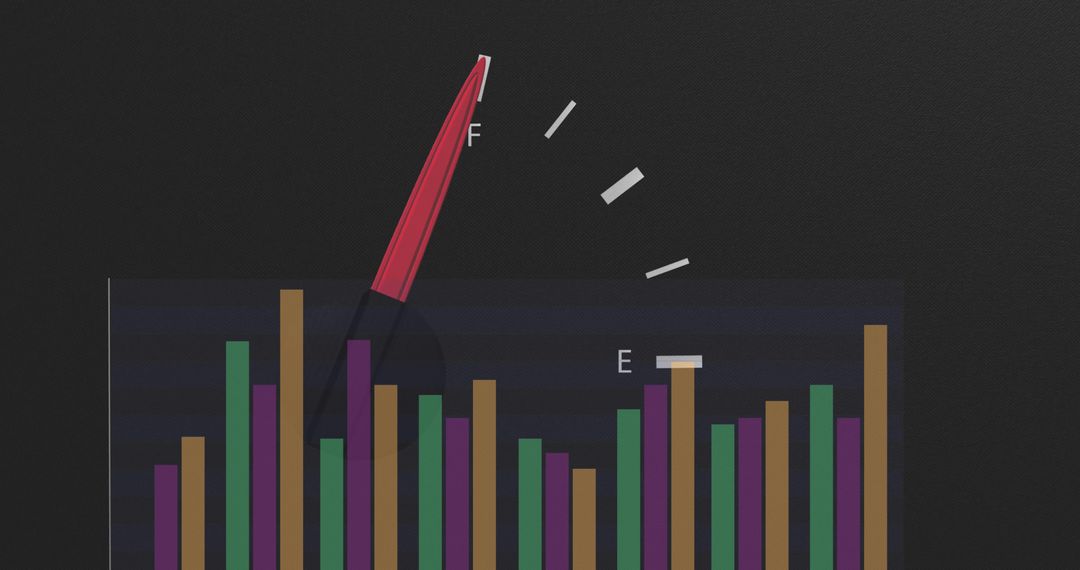
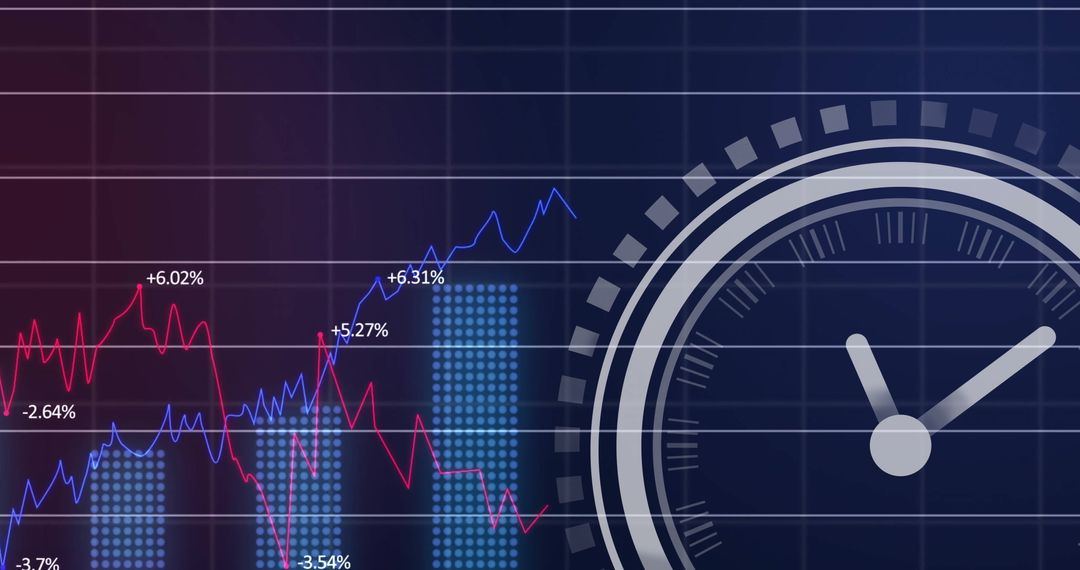
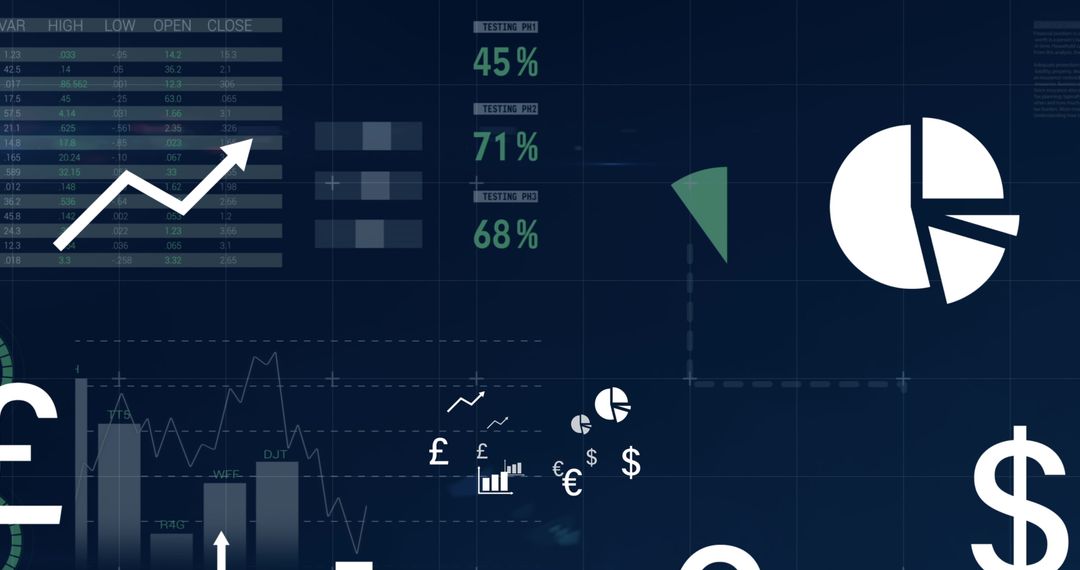
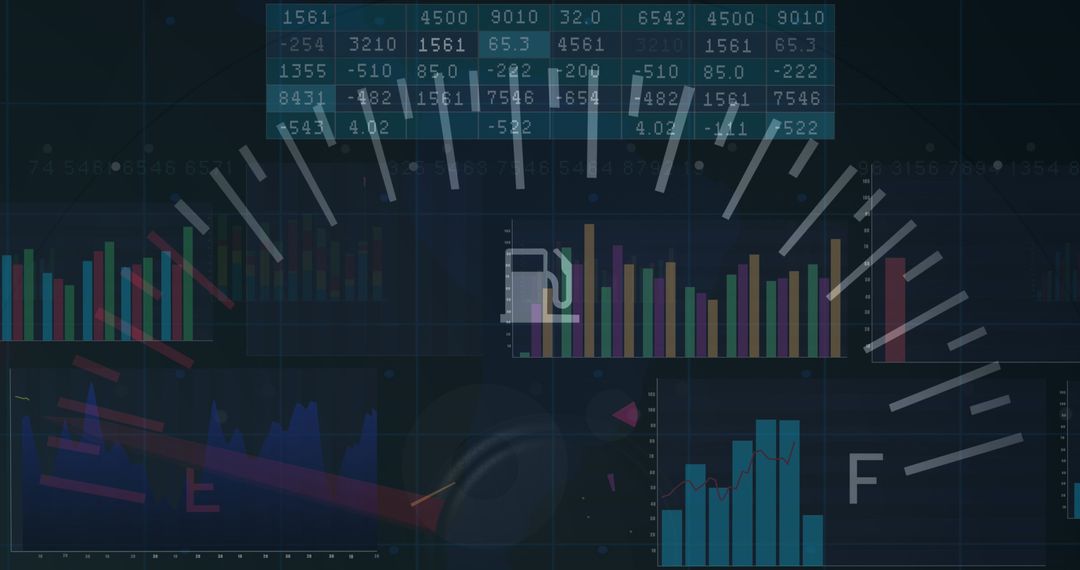
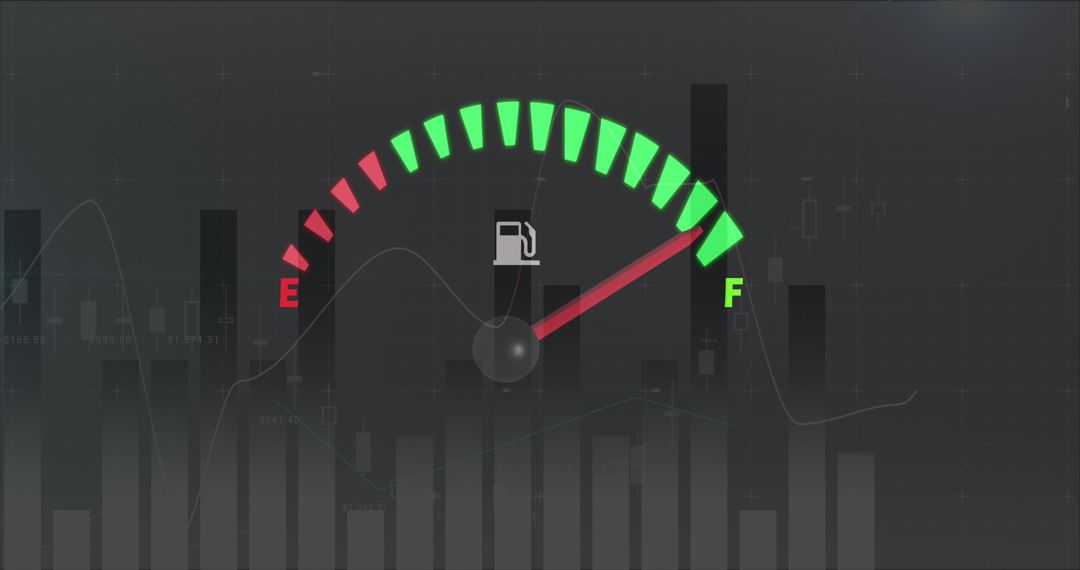
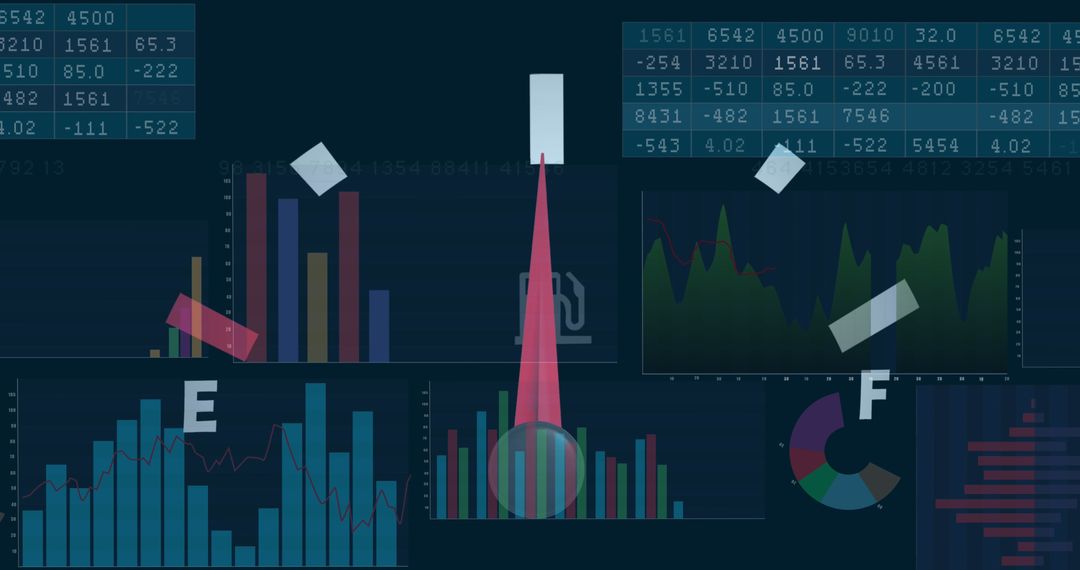
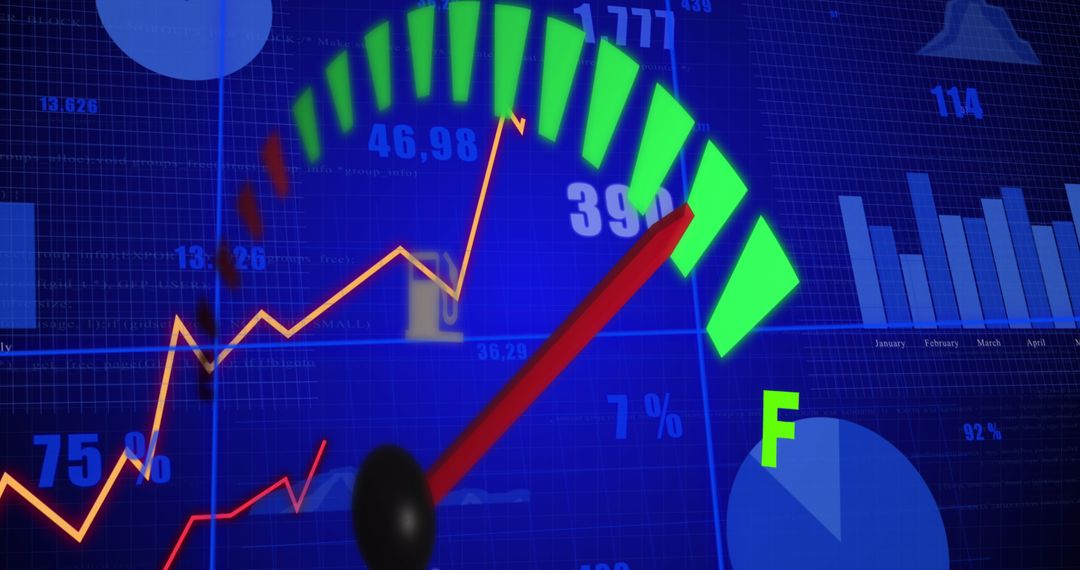
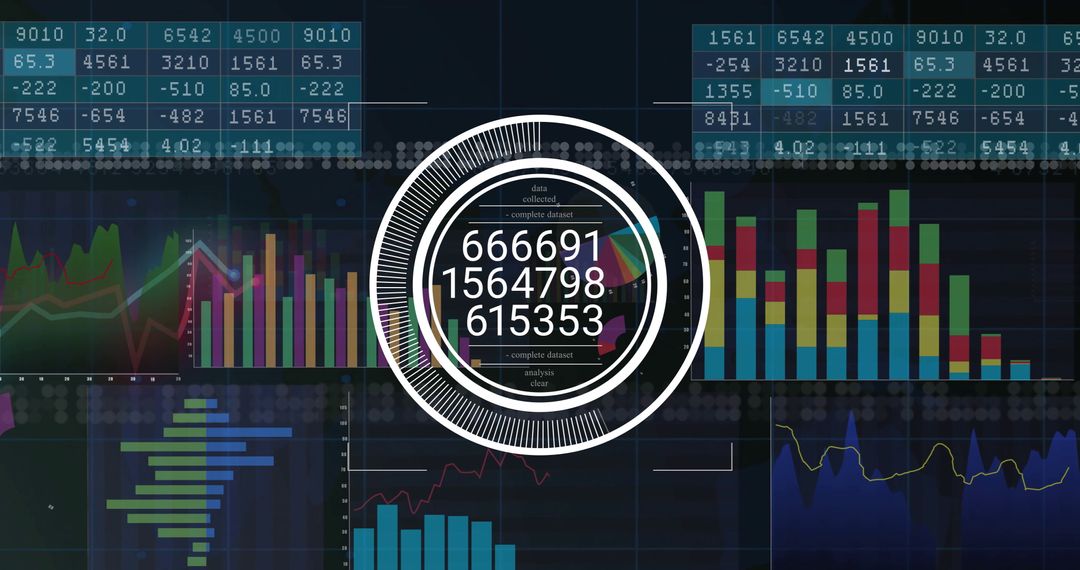
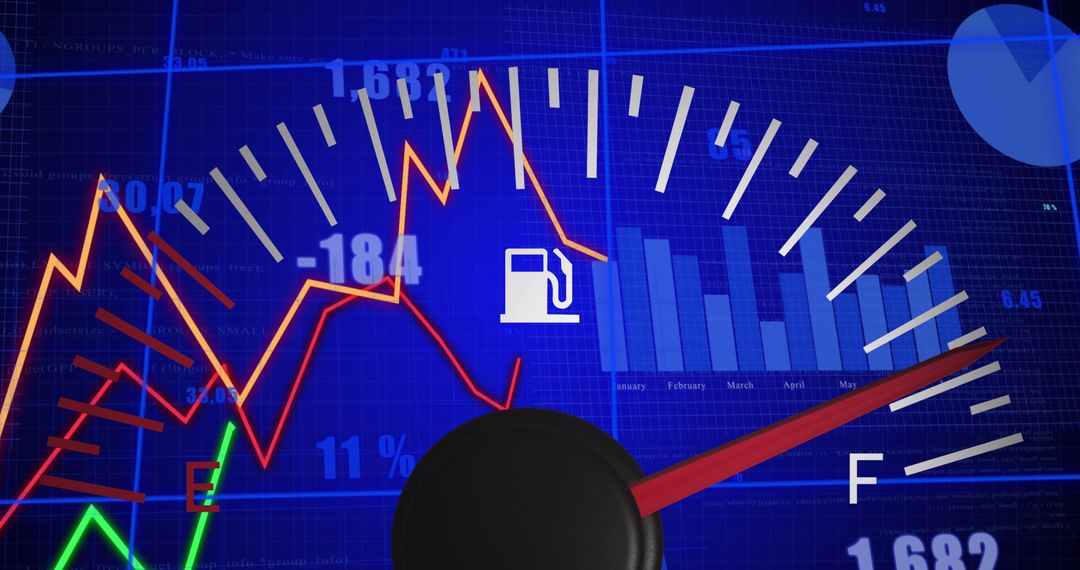
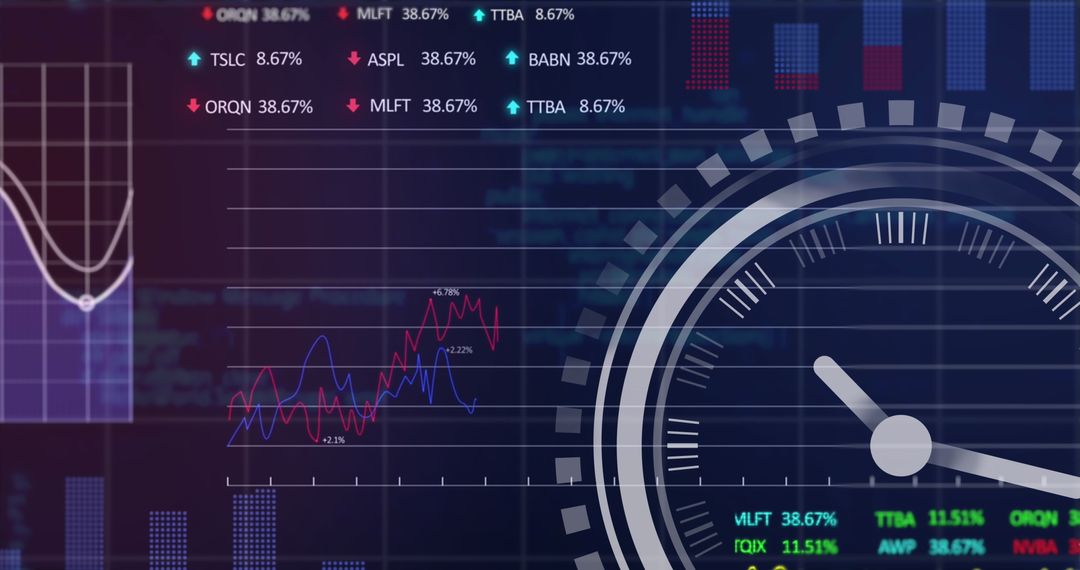
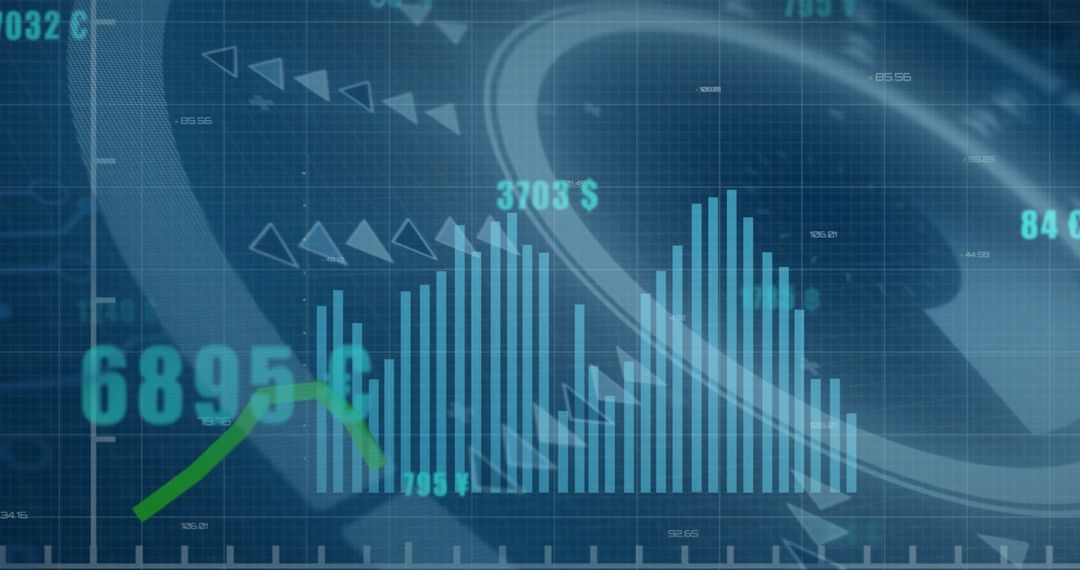
- Digital Dashboard: Analyzing Global Business and Financial Data
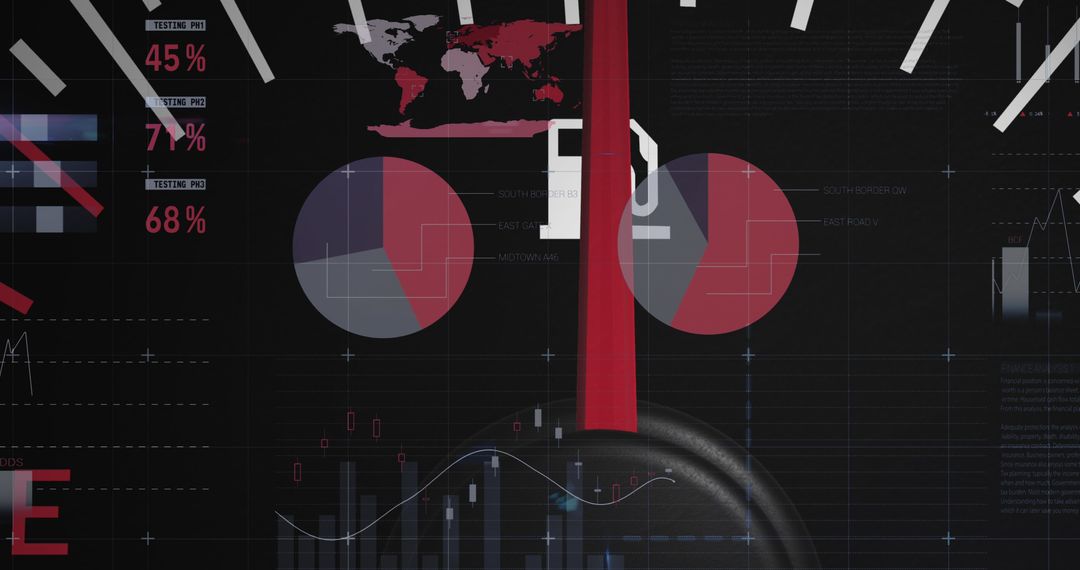
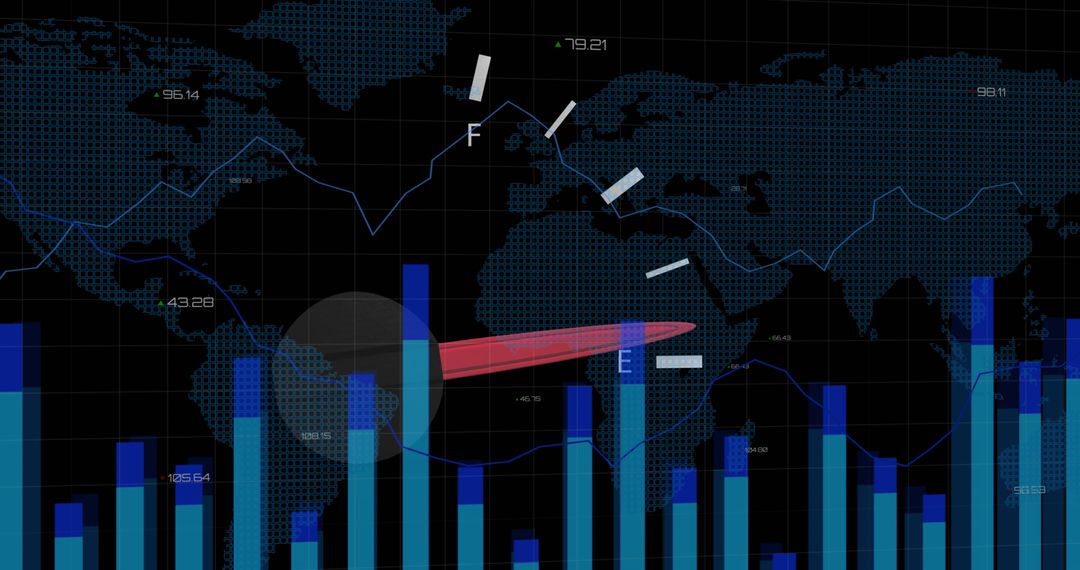
Digital Dashboard: Analyzing Global Business and Financial Data Image
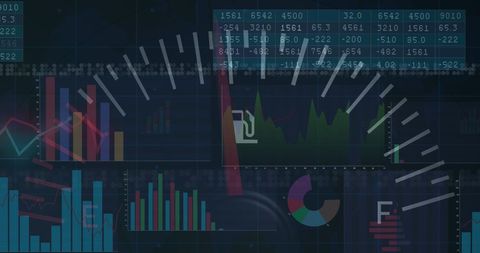
Collage of financial graphs and data visuals layered over a car dashboard interface. Ideal for illustrating articles or presentations on the integration of technology in the financial sector, big data analytics, or global business trends. Suitable for educational materials focusing on data visualization and digital financial tools demonstration.
Powered by 


2
downloads
downloads
Tags:
More
Credit Photo
If you would like to credit the Photo, here are some ways you can do so
Text Link
photo Link
<span class="text-link">
<span>
<a target="_blank" href=https://pikwizard.com/photo/digital-dashboard-analyzing-global-business-and-financial-data/20b84184770fa84872e1a26cdd15f0e3/>PikWizard</a>
</span>
</span>
<span class="image-link">
<span
style="margin: 0 0 20px 0; display: inline-block; vertical-align: middle; width: 100%;"
>
<a
target="_blank"
href="https://pikwizard.com/photo/digital-dashboard-analyzing-global-business-and-financial-data/20b84184770fa84872e1a26cdd15f0e3/"
style="text-decoration: none; font-size: 10px; margin: 0;"
>
<img src="https://pikwizard.com/pw/medium/20b84184770fa84872e1a26cdd15f0e3.jpg" style="margin: 0; width: 100%;" alt="" />
<p style="font-size: 12px; margin: 0;">PikWizard</p>
</a>
</span>
</span>
Free (free of charge)
Free for personal and commercial use.
Author: Awesome Content
Similar Free Stock Images

Premium


Premium

Premium


Premium


Premium


Premium


Premium

Premium


Premium


Premium


Premium


Premium


Premium


Premium
Premium


Premium


Premium


Premium


Premium

Premium


Premium


Premium


Premium


Premium