1. Home > 
  2. Stock Photos > 
  3. Digital Dashboard Display with Data Analytics and Graphs Overlay

Digital Dashboard Display with Data Analytics and Graphs Overlay Image

Digital Dashboard Display with Data Analytics and Graphs Overlay

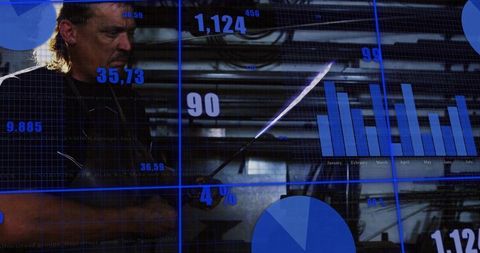
Digital dashboard showcasing various data visualizations, including bar and pie charts, offering insights in real time. Ideal for illustrating subjects related to technology, analytics, and innovation. Perfect for use in presentations on digital transformation, data-driven decision-making, or illustrating analytical reports.

Powered by Adobe logo
Businesswoman analyzing holographic financial data with smart glasses - Powered by AdobeAbstract data flow: colorful streams merging into binary code on dark blue. Big data pipeline, ETL, AI, machine learning, neural network, analytics, integration, digital transformation. - Powered by AdobeTruck freight transportation digital technology data logistics speed innovation delivery modern highway motion network efficiency vehicle urban infrastructure connectivity future AI predictive - Powered by AdobeData analytics and big data strategy for real-time analytics, predictive data modeling, business intelligence analytics, and data-driven decision-making in modern digital businesses. Thunk - Powered by AdobeBusiness Leader Presenting Data Analytics in Modern Boardroom Meeting - Powered by Adobe

Credit Photo

If you would like to credit the Photo, here are some ways you can do so

Free (free of charge)

Free for personal and commercial use.

Author: People Creations

Similar Free Stock Images

Loading...
Global Finance Technology With Floating Mathematical Equations
Premium
Businessman using smartphone with virtual analytics dashboard and data interface on dark background for digital business and fintech concept.
Digital Interface Displaying Financial Data Charts and Graphs
Digital Data Analysis Over World Map Background
Futuristic Financial Chart Overlay with Cityscape Background
Digital Interface with Numbers and Arrows in Motion
Premium
A diverse team collaborates around a glowing holographic data interface in a sunlit office – innovation, digital transformation, corporate strategy
Abstract World Map With Data Processing and Blue Lights
Global Financial Data Analytics with Abstract Digital Concept
Digital Globe Surrounded by Financial Graphs and Market Data Symbolizing Global Economy
Global Business Interface with Digital Data Visualization Concepts
Global Financial Data Processing with Cityscape Overlay
Digital Interface Displaying Global Financial and Business Data
Premium
An analyst uses a computer and dashboard for data business analysis and Data Management System with KPI and metrics connected to the database for technology finance, operations, sales, marketing
Digital Globe with Data Overlay and Holographic Effects
Global Data Visualization Interface with Rotating Earth
Futuristic 6G Technology with Digital Interface and Global Connectivity
Business Data Processing with Countdown on Global Communication Interface
Futuristic Dashboard with Dynamic Data Analytics
Premium
Futuristic digital dashboard with glowing stock market graphs and blurred city skyline background reflecting advanced finance technology and data analytics
World Map with Data Visualizations and Charts over Blue Background
Futuristic Data Dashboard with Holographic Interface Design
Globe Viewing Financial Charts in Innovative Data Hub Visualization
Premium
Data analyzing and stock market visualization with digital charts, financial dashboards, and performance metrics. Ideal for investment analysis, trading strategy, and economic forecasting.
Premium
Businessman using digital warehouse inventory management dashboard system on laptop in smart warehouse, logistics technology and supply chain management concept
Futuristic Data Visualization Over Urban Night Skyline
Global Financial Markets and Urban skyline with Candlestick Charts
Digital Analytics Dashboard with Pie Chart and Line Graph
Digital Globe with Binary Code on Futuristic Interface
Premium
business professional interacting with AI-driven KPI dashboards and data analytics visuals, showcasing modern performance metrics, digital insights, and advanced business intelligence technology.
Futuristic Blue Data Dashboard Displaying Bar Chart and Percentage Metrics
Futuristic Digital World Interface with Spinning Globe
Dynamic Financial Data Visualization Over Black Background
Premium
Futuristic digital dashboard displays business growth metrics. Data visualization shows product lifecycle, market launch, end-of-life performance. Technology concept with chart graphs, cyber space
Digital Interface Overlay with Tech Graphs and Stats
Premium
Businessman analyzing interactive analytics dashboard showing bar charts pie charts KPI graphs visual data reports performance metrics digital technology smart finance strategic tools
Global Financial Data and Connection Network Structure
Global Digital Infographic Interface with Map and Data Numbers
Digital Financial Data Processing with Server Technology
Premium
Data flow from database and cloud to processing and analytics dashboards, representing data analysis, automation, insight generation, and digital intelligence Latch
Premium
Dynamic digital dashboard showcasing financial analytics and task completion on futuristic transparent interface, driving business growth and efficiency.
Businesswoman Analyzing Digital Financial Data and Charts
Global Financial Data with World Map Interface Visualization
Digital Data Analysis Interface with Financial Graphs and Codes
Global Data Processing and Technology Conceptual Visualization
Premium
Businessman analyzing financial data on futuristic digital screen with graphs and charts on a dark background, showcasing the finance growth concept.
Digital Earth with Financial Data Visualization Concept
Global Digital Network with Data Points on World Map
Global Network Connectivity on World Map
Premium
A man analyzes multiple digital data dashboards displaying charts and graphs, immersed in a high-tech control room environment.
Futuristic Digital Interface with World Map and Data Overlays
Global Market Downturn on Digital Analytics Dashboard
Digital Interface Showing Data Visualization with Analytics Charts
Premium
Laptop screen displaying financial data charts.
Global Financial Data with Analytics Overlay Concept
Futuristic Global Data Analytics with Translucent Earth Visualization
Night Highway Overpass with Dynamic Financial Chart Overlay
Futuristic Digital Data Analytics with World Map and Charts
Digital Interface with World Map and Data Analytics Visualization
Premium
Marketer using digital marketing dashboard with charts, pie graphs, organization chart, and performance data. Concept of business analytics and strategic planning.
Futuristic Data Analytics Dashboard with Bar and Pie Charts
Digital Dashboard Interface with Analytics and World Map
Digital Data Analysis with Virus Imagery and Security Interface
Financial Analytics with Graphs and Data on Digital Interface
Dynamic Digital Interface Representing Global Finance and Data Processing
Dynamic Digital Interface with Question Marks on Statistics Background
Data Visualization Over Cityscape
Abstract Digital Data Interface with Blue Background
Futuristic Business Technology with Digital Graph Interface
Financial Data Overlay on Office Setting Reflections
Futuristic Global Networking and Data Exchange Map
Abstract Financial Data Chart with Circles and Bar Graphs
Global Networking Cybersecurity Infrastructure with Digital Overlay
Premium
Data-Driven Approaches Transforming Modern Economics, Abstract digital visualization with vibrant bars representing data metrics against a blue background.
Victory Message Over Futuristic Digital Interface
Financial Data Visualization Over Global Map with Digital Globe
Futuristic Digital Interface With Global Data Networking
Global Data Processing with Neural Networks Technology Interface
Premium
AI data analytics dashboard, business data insights, AI-powered data analysis dashboard, business strategy, Analyst or Scientist uses a computer and dashboard for analysis of information development
Premium
Businessman interacting with futuristic financial growth chart hologram
Innovative Digital Bar Chart Showing Monthly Insights on Tech Screen
Holographic Digital Interface with Floating Data Panels
Earth Visualized Within Digital Data and Analytics Interface
Futuristic Digital Interface with Data Visualization and Graphics
Dynamic Particle Wave with Futuristic Data Dashboard Elements
Global Financial Dashboard with Earth and Stock Market Data
Data Analyst in Virtual Space with Holographic Charts and Globe
Financial Analytics Overlay on Urban Skyline at Night
Premium
Young man in glasses stands near big screen with colorful charts. He works in office near digital data. Pro leader analyzes company success.
Global Financial Trading with Digital Data Visualization
3D Digital Globe with Data Visualizations in Futuristic Interface
Data Visualization Digital Interface with Bar Chart Analytics
Rotating 3D Globe with Data Analytics on Digital Dashboard
Premium
Business analyst reviewing digital charts and data on interactive performance dashboard.
Abstract Visualization of Financial Data and Digital Analysis
Financial Data Visualization in Blue with Dynamic Graphics
Digital Data Processing on Global Map Concept
Premium
Digital Supply Chain Management
Global Inflation Trend Analysis with Digital Graphics and World Map
Global Financial Data Visualizations and Cloud Computing Interface
Digital Data Processing Over Modern Cityscape
Premium
A professional observing a wall of glowing digital screens filled with complex data analytics and charts
Futuristic Digital Code and Data Visualization Overlays
Financial Data Visualization with Bars and Pie Charts
Global Digital Interface with Financial Data Overlaid on Earth
Global Financial Analytics with Digital Interface and Earth Visualization
Premium
Dynamic digital financial graph with glowing purple and blue trend lines on dark background displaying market analytics data for investment technology
Global Financial Markets and Data Analytics
Global Business Trends and Digital Financial Analytics Visualization
Global Business Data with World Map and QR Code Visualization
Futuristic Data Processing Metadata Technology Display
Digital Finance Concept with Cityscape Background
Futuristic Global Map With Data Connectivity
Futuristic Holographic World Map with Data Streams
Digital Finance Dashboard with Rising Graph and Percentages
Premium
Man look at the dashboard with graphs and charts. Concept of data management system, business intelligence, data statistics, marketing analysis, key performance indicators (KPI) and analytics.
Futuristic Digital Dashboards with Data Visualizations and Analytics
Digital Wireframe Handshake on High-Tech Interface Background
Financial Data Visualization Against City Background
Dynamic Financial Data Visualization with Highway Background
Futuristic Cityscape with Digital Data Analytics Overlay
Premium
A close-up of a digital screen displaying various data charts, graphs, and analytics in a modern office environment.
Futuristic Data Analytics Dashboard with Digital Globe
Dynamic Data Visualization With Blue Bar Graph and Abstract Elements
Displaying Blue Data Dashboard with Analytics Metrics, Radar Targets and KPI Charts