
- Home >
- Stock Photos >
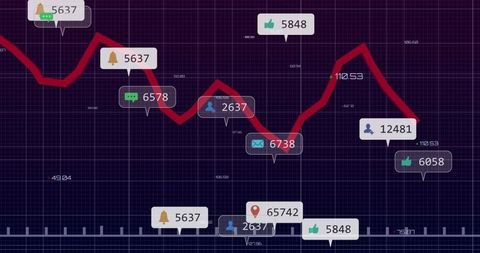
- Digital Dashboard Displaying Analytics and Financial Indicators
Digital Dashboard Displaying Analytics and Financial Indicators Image

Illustration featuring grid-based interfaces showcasing techniques in data analytics and financial monitoring. Ideal for depicting modern technology used in business intelligence and investing. It resonates well for presentations, articles or news related to market analysis.
Powered by  - Get 15% off with code: PIKWIZARD15


downloads
Tags:
More
Credit Photo
If you would like to credit the Photo, here are some ways you can do so
Text Link
photo Link
<span class="text-link">
<span>
<a target="_blank" href=https://pikwizard.com/photo/digital-dashboard-displaying-analytics-and-financial-indicators/92ac72d41cd0065ddbcd3c6c3c21dfc7/>PikWizard</a>
</span>
</span>
<span class="image-link">
<span
style="margin: 0 0 20px 0; display: inline-block; vertical-align: middle; width: 100%;"
>
<a
target="_blank"
href="https://pikwizard.com/photo/digital-dashboard-displaying-analytics-and-financial-indicators/92ac72d41cd0065ddbcd3c6c3c21dfc7/"
style="text-decoration: none; font-size: 10px; margin: 0;"
>
<img src="https://pikwizard.com/pw/medium/92ac72d41cd0065ddbcd3c6c3c21dfc7.jpg" style="margin: 0; width: 100%;" alt="" />
<p style="font-size: 12px; margin: 0;">PikWizard</p>
</a>
</span>
</span>
Free (free of charge)
Free for personal and commercial use.
Author: People Creations
Similar Free Stock Images

Premium


Premium


Premium


Premium


Premium


Premium

Premium


Premium


Premium


Premium


Premium

Premium

Premium


Premium


Premium


Premium


Premium


Premium


Premium


Premium

Premium


Premium


Premium


Premium


Premium


Explore More Free Stock Images