- Home >
- Stock Photos >
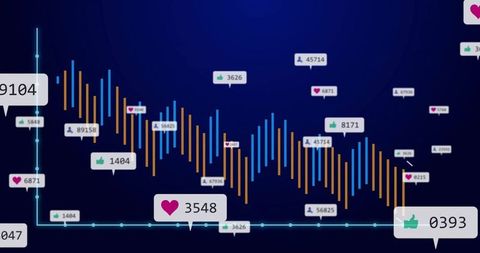
- Digital Dashboard Displaying Interactive Data Visualizations
Digital Dashboard Displaying Interactive Data Visualizations Image

Digital dashboard showing red and blue line graphs with real-time bubble labels and percentages. Highly engaging interactive layout serves to illustrate patterns, growth, or audience engagement on an expansive world map backdrop. Perfect for reports, presentations, or demonstrating data-driven insights to enhance user decision-making and strategy conflictions in modern business environments.

downloads
Tags:
More
Credit Photo
If you would like to credit the Photo, here are some ways you can do so
Text Link
photo Link
<span class="text-link">
<span>
<a target="_blank" href=https://pikwizard.com/photo/digital-dashboard-displaying-interactive-data-visualizations/c8aca2ff9fd2d85a4ea5ea3c4e43bcbf/>PikWizard</a>
</span>
</span>
<span class="image-link">
<span
style="margin: 0 0 20px 0; display: inline-block; vertical-align: middle; width: 100%;"
>
<a
target="_blank"
href="https://pikwizard.com/photo/digital-dashboard-displaying-interactive-data-visualizations/c8aca2ff9fd2d85a4ea5ea3c4e43bcbf/"
style="text-decoration: none; font-size: 10px; margin: 0;"
>
<img src="https://pikwizard.com/pw/medium/c8aca2ff9fd2d85a4ea5ea3c4e43bcbf.jpg" style="margin: 0; width: 100%;" alt="" />
<p style="font-size: 12px; margin: 0;">PikWizard</p>
</a>
</span>
</span>
Free (free of charge)
Free for personal and commercial use.
Author: Authentic Images