
- Home >
- Stock Photos >
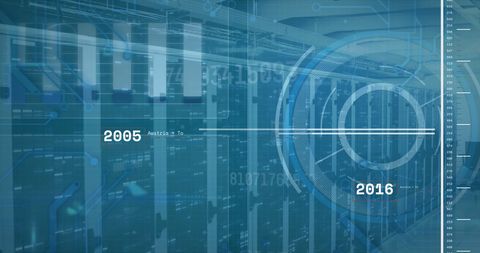
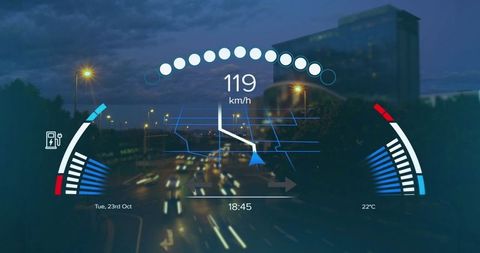
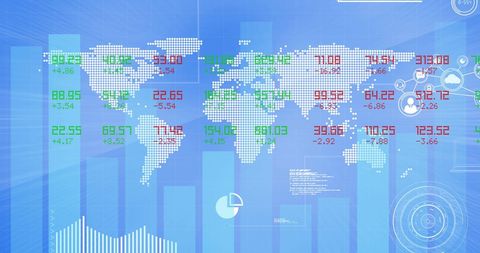
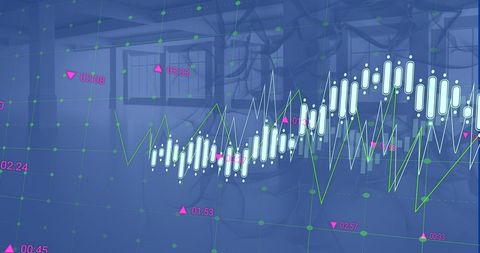
- Digital Dashboard Displaying Speed and Data Analysis
Digital Dashboard Displaying Speed and Data Analysis Image
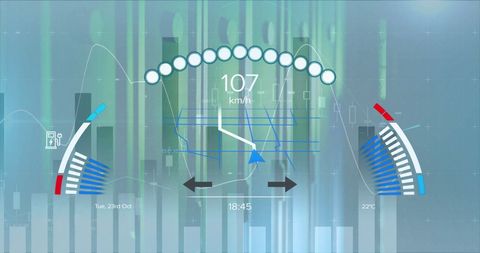
Graphic of digital speedometer and analytic charts overlaying server room visualization. Vibrant interaction between speeding metrics and data analysis suggesting technological and ecological advancements. Ideal for illustrating information technology advancements, data management solutions, or artificial intelligence analytics.
Powered by 


downloads
Tags:
More
Credit Photo
If you would like to credit the Photo, here are some ways you can do so
Text Link
photo Link
<span class="text-link">
<span>
<a target="_blank" href=https://pikwizard.com/photo/digital-dashboard-displaying-speed-and-data-analysis/f10cbf4e4292be347483c4393f5754e0/>PikWizard</a>
</span>
</span>
<span class="image-link">
<span
style="margin: 0 0 20px 0; display: inline-block; vertical-align: middle; width: 100%;"
>
<a
target="_blank"
href="https://pikwizard.com/photo/digital-dashboard-displaying-speed-and-data-analysis/f10cbf4e4292be347483c4393f5754e0/"
style="text-decoration: none; font-size: 10px; margin: 0;"
>
<img src="https://pikwizard.com/pw/medium/f10cbf4e4292be347483c4393f5754e0.jpg" style="margin: 0; width: 100%;" alt="" />
<p style="font-size: 12px; margin: 0;">PikWizard</p>
</a>
</span>
</span>
Free (free of charge)
Free for personal and commercial use.
Author: Authentic Images
Similar Free Stock Images

Premium


Premium

Premium


Premium


Premium

Premium


Premium


Premium


Premium

Premium

Premium


Premium


Premium


Premium
Premium


Premium


Premium


Premium


Premium
Premium


Premium


Premium


Premium


Premium


Premium

Explore More Free Stock Images