- Home >
- Stock Photos >
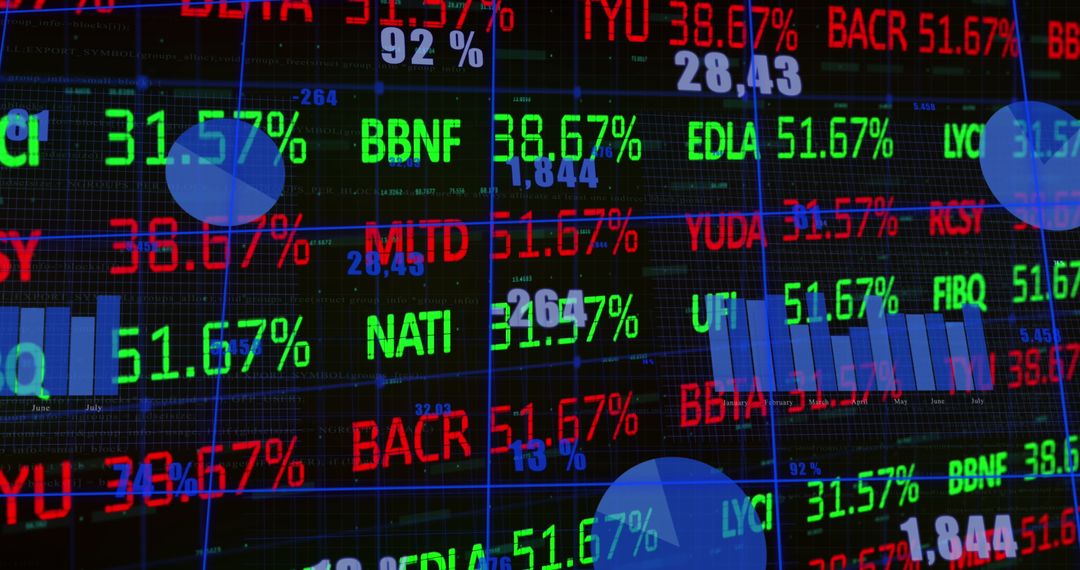
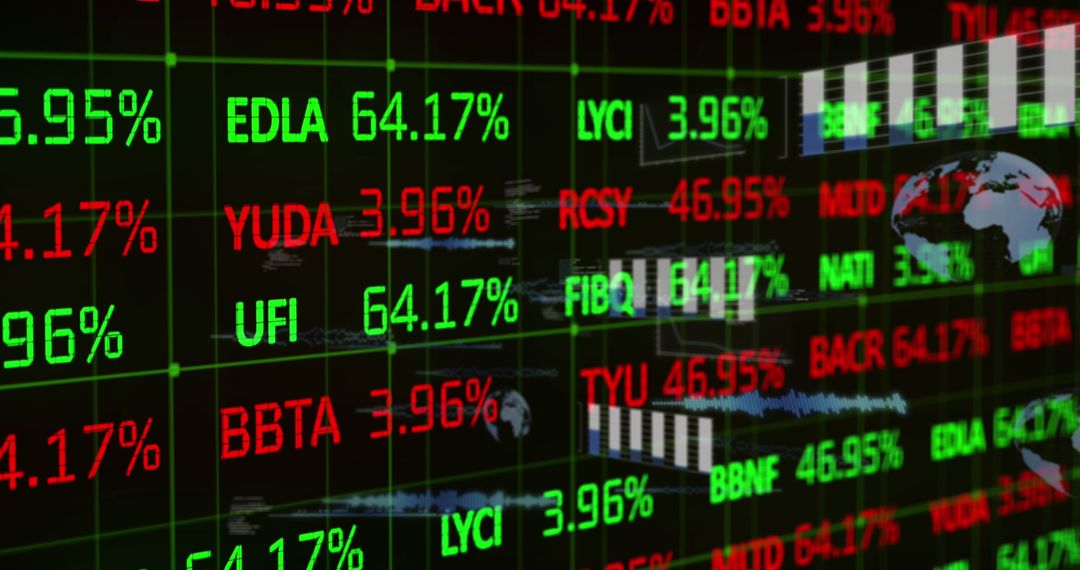
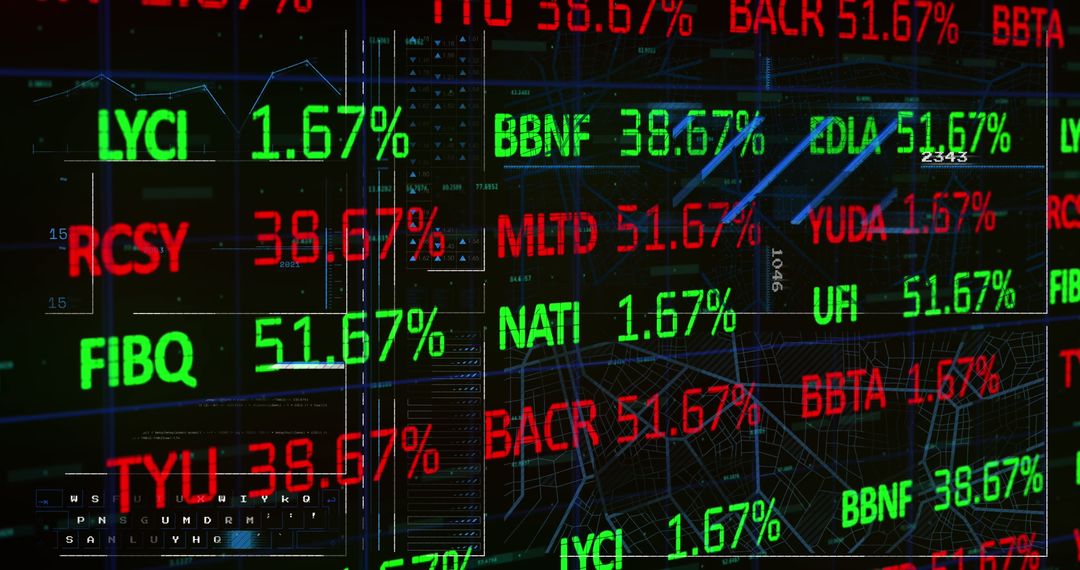
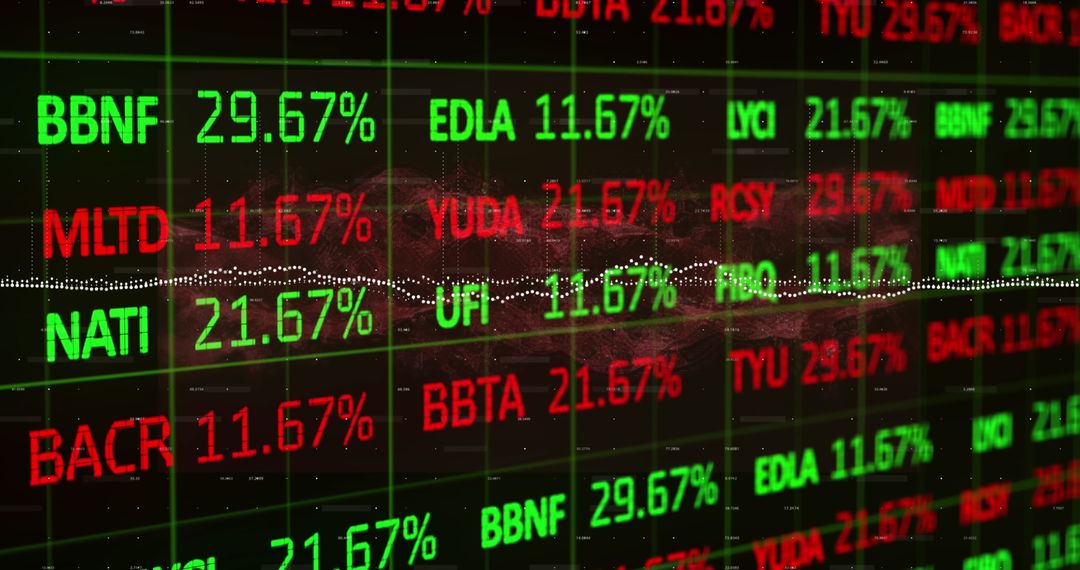
- Digital Dashboard Displaying Stock Market Data Trends
Digital Dashboard Displaying Stock Market Data Trends Image
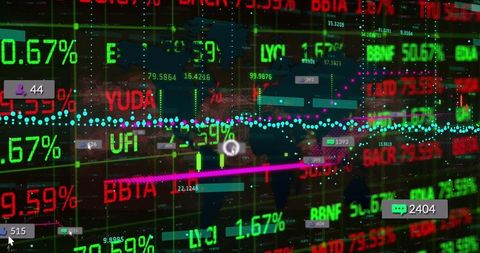
Dynamic display of financial data with ticker symbols and percentages exemplifying real-time stock market activity. Featuring layered digital interfaces crossing trend lines over a world map. Ideal for illustrating concepts in finance, investments, stock trends, data analysis, or for use in reports on modern technology and digital innovation in analytics.
Powered by  - Get 15% off with code: PIKWIZARD15


2
downloads
downloads
Tags:
More
Credit Photo
If you would like to credit the Photo, here are some ways you can do so
Text Link
photo Link
<span class="text-link">
<span>
<a target="_blank" href=https://pikwizard.com/photo/digital-dashboard-displaying-stock-market-data-trends/29d4c44273cbc61d9a20f54eb5886460/>PikWizard</a>
</span>
</span>
<span class="image-link">
<span
style="margin: 0 0 20px 0; display: inline-block; vertical-align: middle; width: 100%;"
>
<a
target="_blank"
href="https://pikwizard.com/photo/digital-dashboard-displaying-stock-market-data-trends/29d4c44273cbc61d9a20f54eb5886460/"
style="text-decoration: none; font-size: 10px; margin: 0;"
>
<img src="https://pikwizard.com/pw/medium/29d4c44273cbc61d9a20f54eb5886460.jpg" style="margin: 0; width: 100%;" alt="" />
<p style="font-size: 12px; margin: 0;">PikWizard</p>
</a>
</span>
</span>
Free (free of charge)
Free for personal and commercial use.
Author: Creative Art
Similar Free Stock Images

Premium


Premium


Premium


Premium


Premium


Premium


Premium


Premium


Premium


Premium


Premium


Premium


Premium


Premium


Premium


Premium


Premium


Premium


Premium


Premium


Premium


Premium


Premium


Premium