- Home >
- Stock Photos >
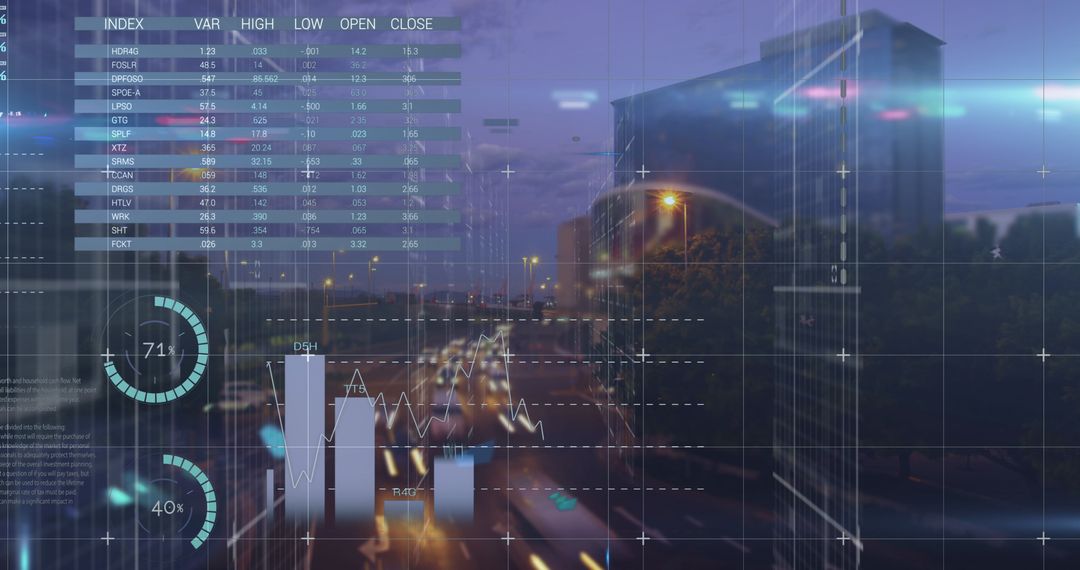
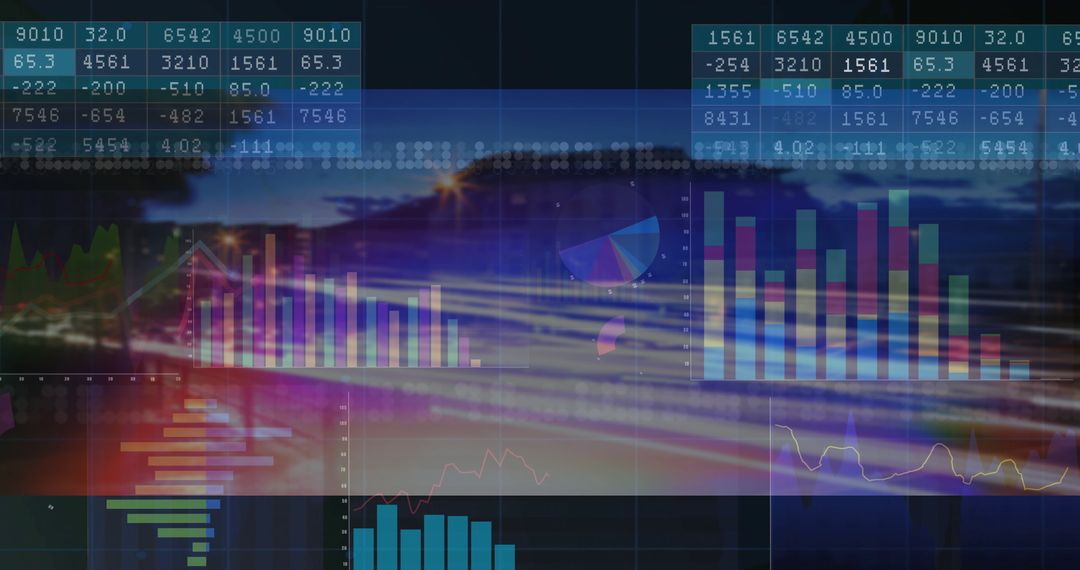
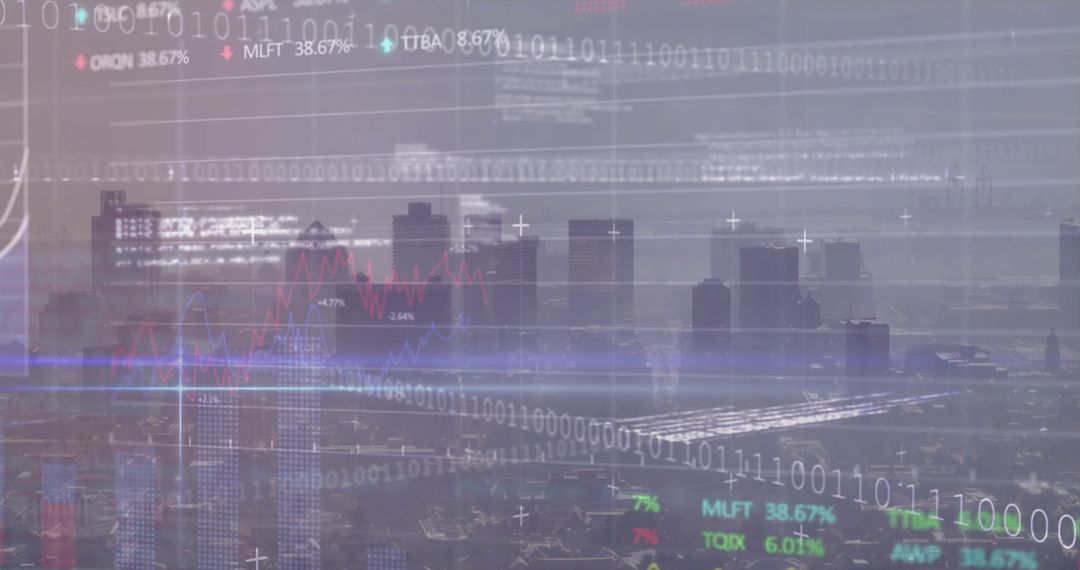
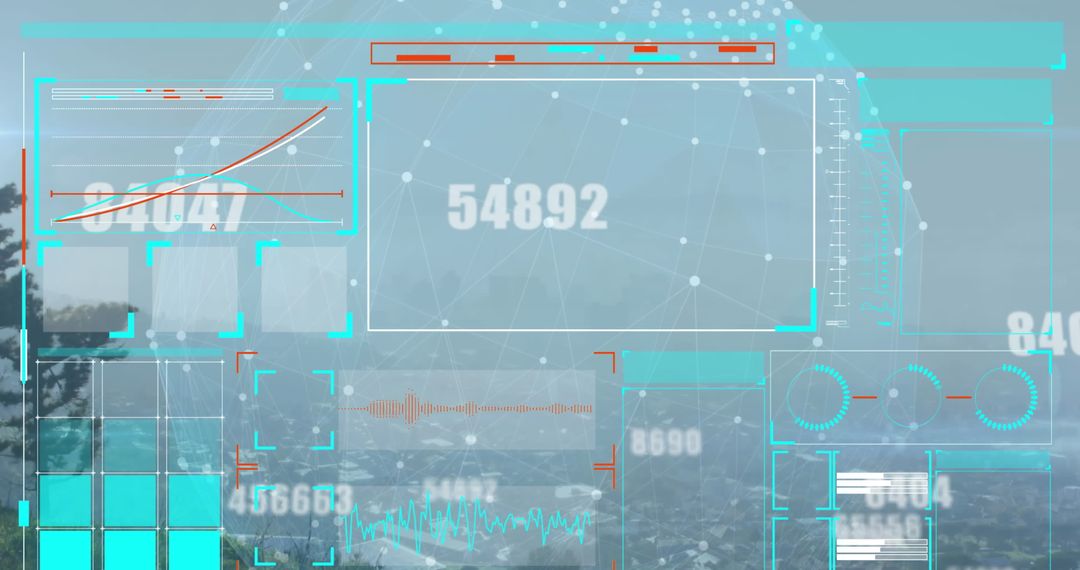
- Digital Dashboard Interface Over Urban Roadway at Night
Digital Dashboard Interface Over Urban Roadway at Night Image

The scene depicts a digital interface overlay on an urban city at night, merging technology with city life. This image showcases elements of data analytics, with charts and numeric data tables appearing as holographic displays above a nighttime road scene. Ideal for representing modern business solutions, fintech advancements, and data-driven decision-making. Useful for industries related to technology trends, urban planning, financial services, or time-sensitive presentations.
Powered by  - Get 15% off with code: PIKWIZARD15


0
downloads
downloads
Tags:
More
Credit Photo
If you would like to credit the Photo, here are some ways you can do so
Text Link
photo Link
<span class="text-link">
<span>
<a target="_blank" href=https://pikwizard.com/photo/digital-dashboard-interface-over-urban-roadway-at-night/fd2df94760ba32d8e577996a67815fc6/>PikWizard</a>
</span>
</span>
<span class="image-link">
<span
style="margin: 0 0 20px 0; display: inline-block; vertical-align: middle; width: 100%;"
>
<a
target="_blank"
href="https://pikwizard.com/photo/digital-dashboard-interface-over-urban-roadway-at-night/fd2df94760ba32d8e577996a67815fc6/"
style="text-decoration: none; font-size: 10px; margin: 0;"
>
<img src="https://pikwizard.com/pw/medium/fd2df94760ba32d8e577996a67815fc6.jpg" style="margin: 0; width: 100%;" alt="" />
<p style="font-size: 12px; margin: 0;">PikWizard</p>
</a>
</span>
</span>
Free (free of charge)
Free for personal and commercial use.
Author: People Creations
Similar Free Stock Images
Premium


Premium


Premium


Premium


Premium


Premium


Premium


Premium


Premium


Premium


Premium


Premium


Premium


Premium


Premium


Premium


Premium


Premium


Premium


Premium


Premium


Premium


Premium


Premium