
- Home >
- Stock Photos >
- Digital Dashboard Interface with Map and Analytics Data Overlay
Digital Dashboard Interface with Map and Analytics Data Overlay Image

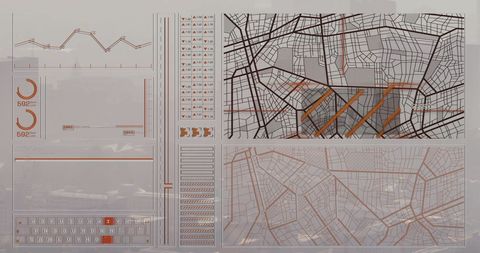
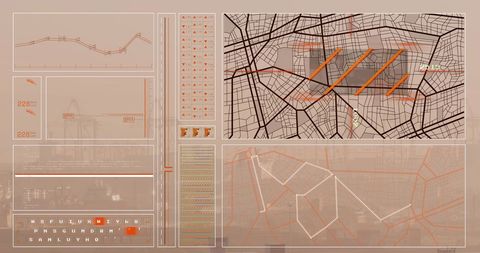
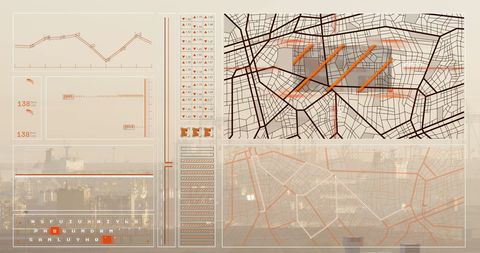
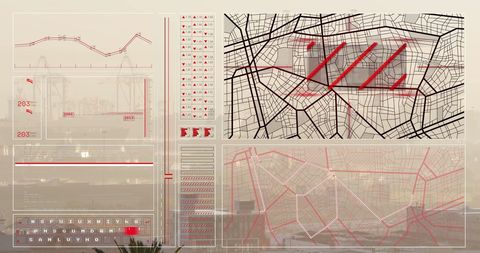
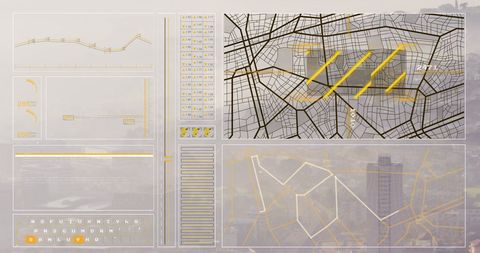
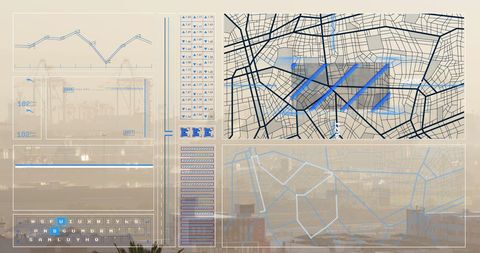
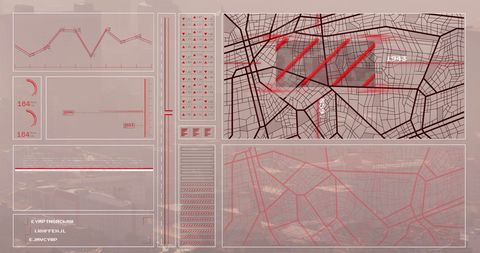
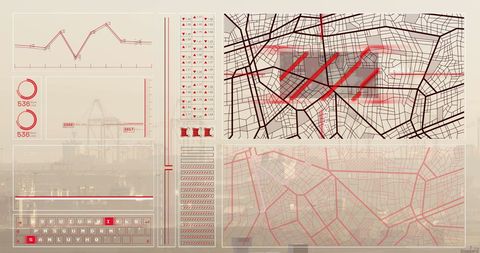
The scene shows a digital interface superimposed on an office environment, showcasing an array of analytics data including line charts and a map grid. Ideal for illustrating themes of technology, data visualization, and business analysis. Useful for presentations, tech blogs, or articles focusing on innovation and data-driven decision-making.
Powered by  - Get 15% off with code: PIKWIZARD15


downloads
Tags:
More
Credit Photo
If you would like to credit the Photo, here are some ways you can do so
Text Link
photo Link
<span class="text-link">
<span>
<a target="_blank" href=https://pikwizard.com/photo/digital-dashboard-interface-with-map-and-analytics-data-overlay/bff334c9c8225bd13c32a6ee258861f6/>PikWizard</a>
</span>
</span>
<span class="image-link">
<span
style="margin: 0 0 20px 0; display: inline-block; vertical-align: middle; width: 100%;"
>
<a
target="_blank"
href="https://pikwizard.com/photo/digital-dashboard-interface-with-map-and-analytics-data-overlay/bff334c9c8225bd13c32a6ee258861f6/"
style="text-decoration: none; font-size: 10px; margin: 0;"
>
<img src="https://pikwizard.com/pw/medium/bff334c9c8225bd13c32a6ee258861f6.jpg" style="margin: 0; width: 100%;" alt="" />
<p style="font-size: 12px; margin: 0;">PikWizard</p>
</a>
</span>
</span>
Free (free of charge)
Free for personal and commercial use.
Author: Authentic Images
Similar Free Stock Images

Premium


Premium

Premium


Premium


Premium


Premium


Premium


Premium

Premium

Premium

Premium


Premium


Premium


Premium


Premium


Premium


Premium


Premium


Premium


Premium


Premium

Premium


Premium


Premium


Premium


Explore More Free Stock Images