- Home >
- Stock Photos >
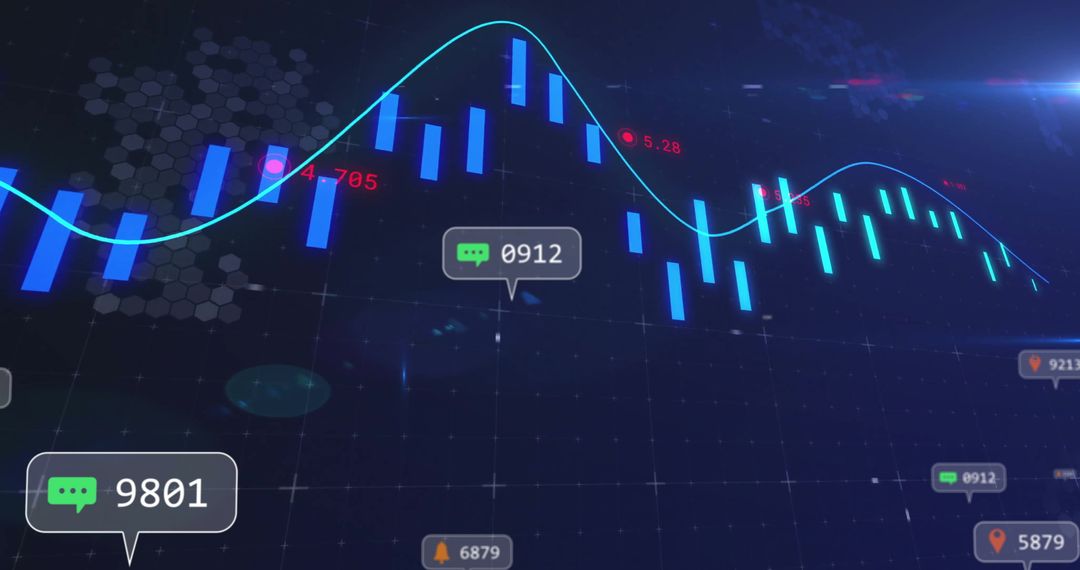
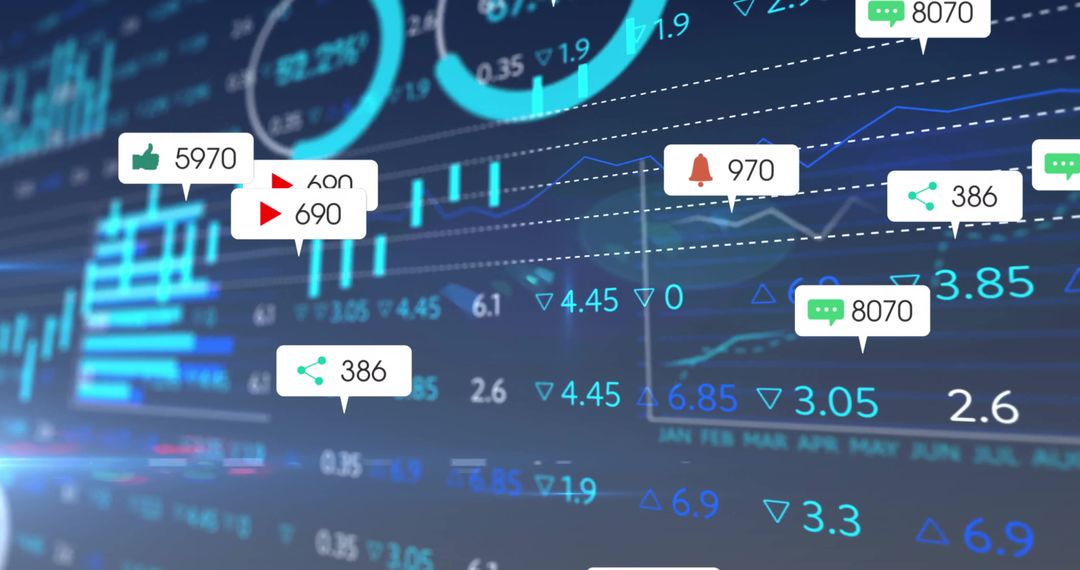
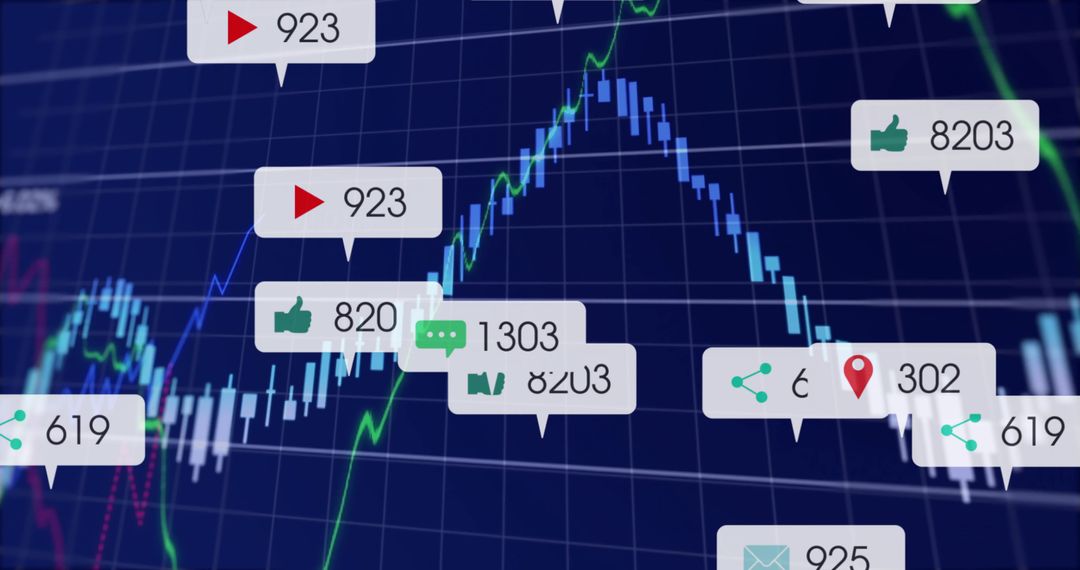
- Digital Dashboard Showing Cryptocurrency Trading with Social Alerts
Digital Dashboard Showing Cryptocurrency Trading with Social Alerts Image

Digital interface presents a dynamic trading dashboard incorporating cryptocurrency charts with overlaid social media notifications such as likes and comments. Useful for visualizing the connection between social sentiment and market trends. Ideal for finance articles, trading platform demos, and presentations on digital trading technologies.
Powered by 


2
downloads
downloads
Tags:
More
Credit Photo
If you would like to credit the Photo, here are some ways you can do so
Text Link
photo Link
<span class="text-link">
<span>
<a target="_blank" href=https://pikwizard.com/photo/digital-dashboard-showing-cryptocurrency-trading-with-social-alerts/99f677ab4f8e19cb03391c752ac62b68/>PikWizard</a>
</span>
</span>
<span class="image-link">
<span
style="margin: 0 0 20px 0; display: inline-block; vertical-align: middle; width: 100%;"
>
<a
target="_blank"
href="https://pikwizard.com/photo/digital-dashboard-showing-cryptocurrency-trading-with-social-alerts/99f677ab4f8e19cb03391c752ac62b68/"
style="text-decoration: none; font-size: 10px; margin: 0;"
>
<img src="https://pikwizard.com/pw/medium/99f677ab4f8e19cb03391c752ac62b68.jpg" style="margin: 0; width: 100%;" alt="" />
<p style="font-size: 12px; margin: 0;">PikWizard</p>
</a>
</span>
</span>
Free (free of charge)
Free for personal and commercial use.
Author: Awesome Content
Similar Free Stock Images

Premium


Premium


Premium


Premium


Premium


Premium


Premium


Premium


Premium


Premium


Premium


Premium


Premium


Premium


Premium


Premium


Premium


Premium


Premium


Premium


Premium


Premium


Premium


Premium