- Home >
- Stock Photos >
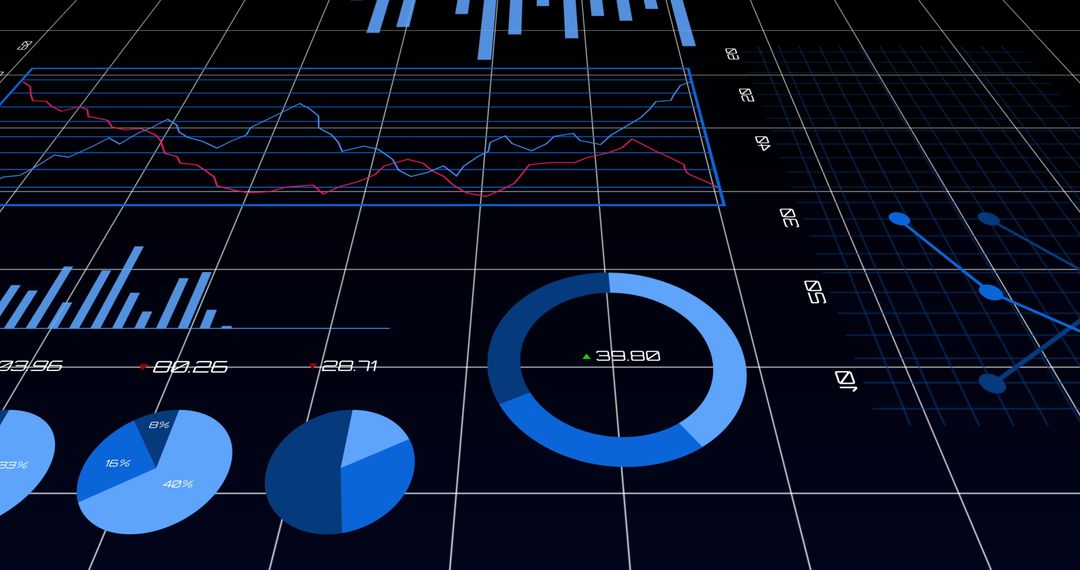
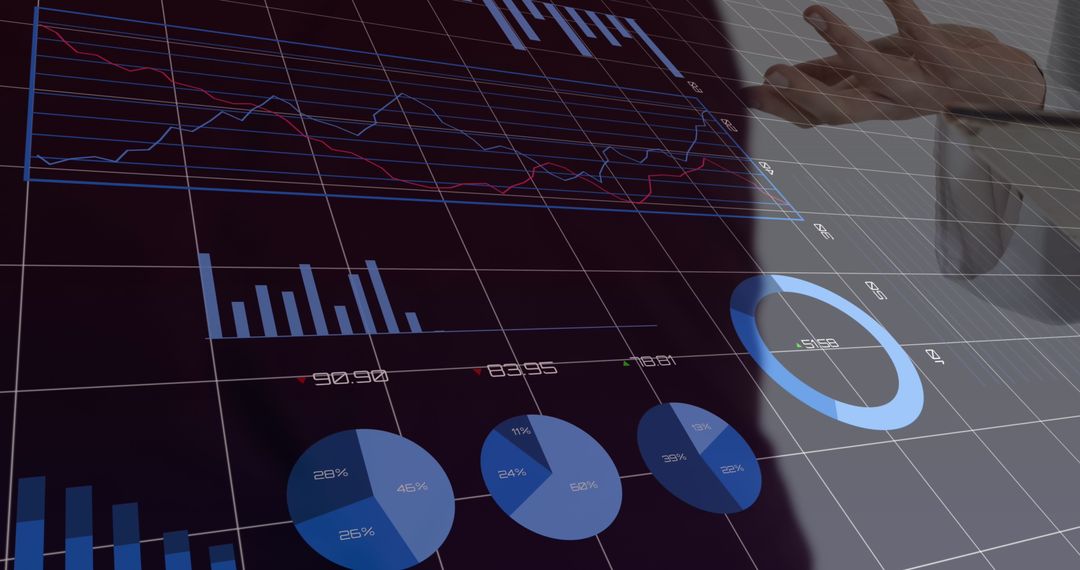
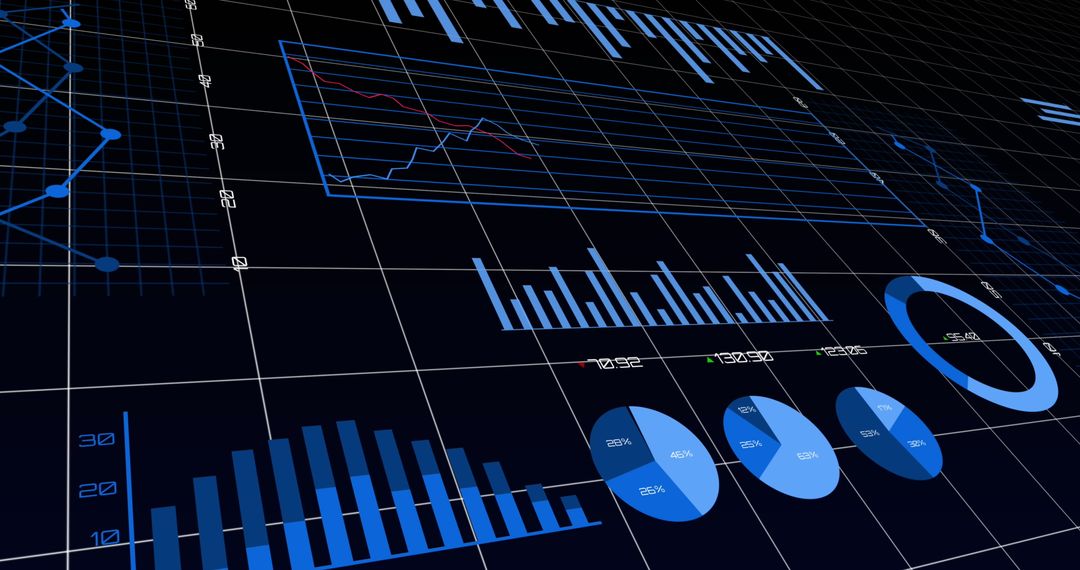
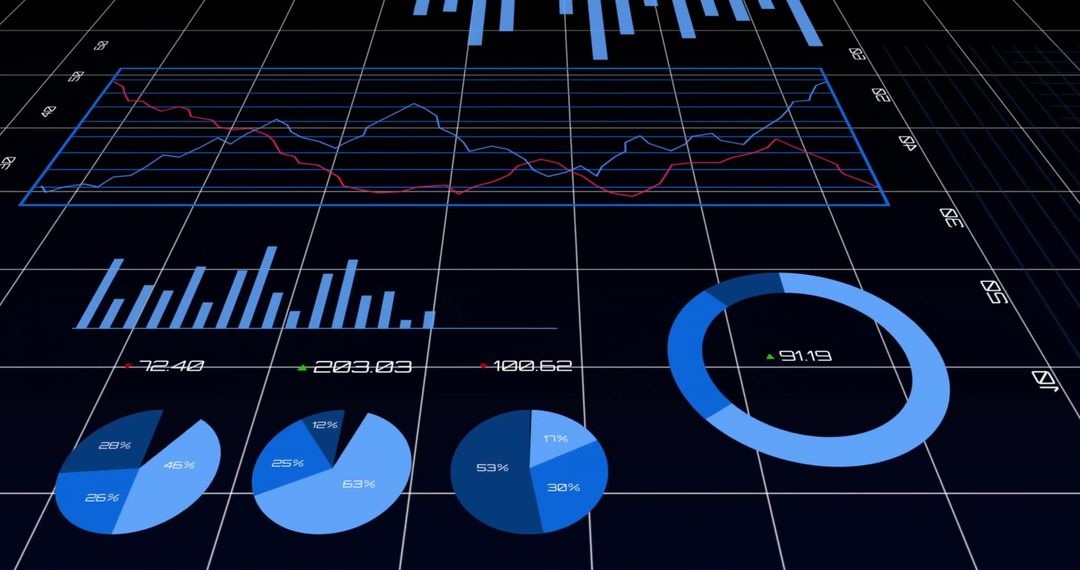
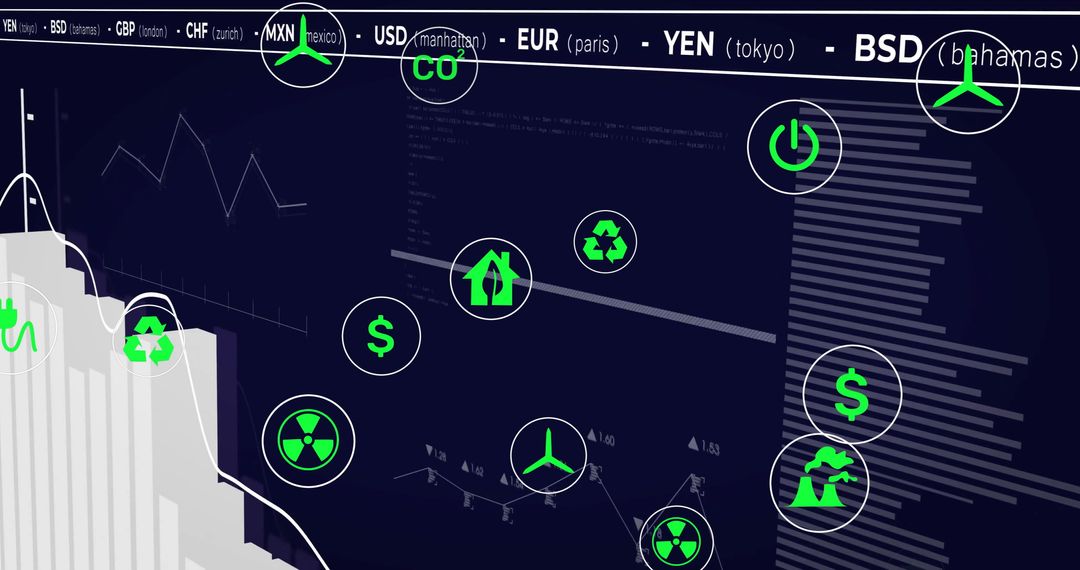
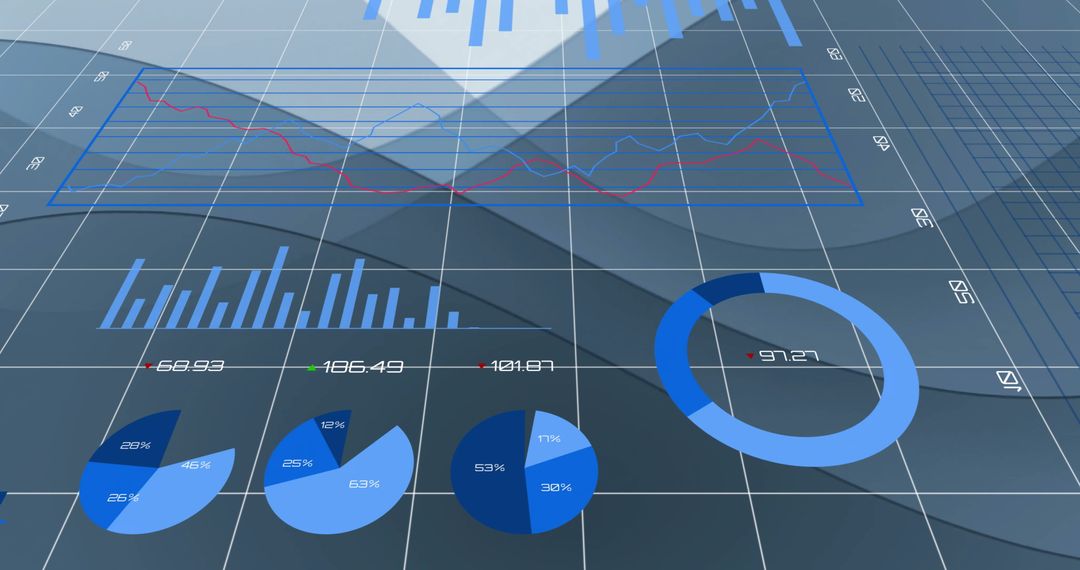
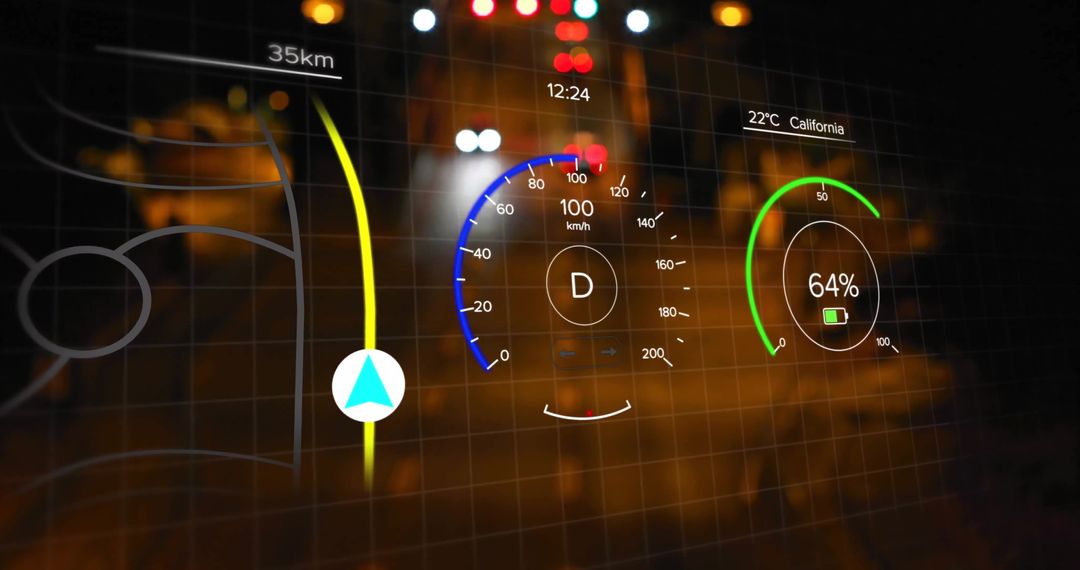
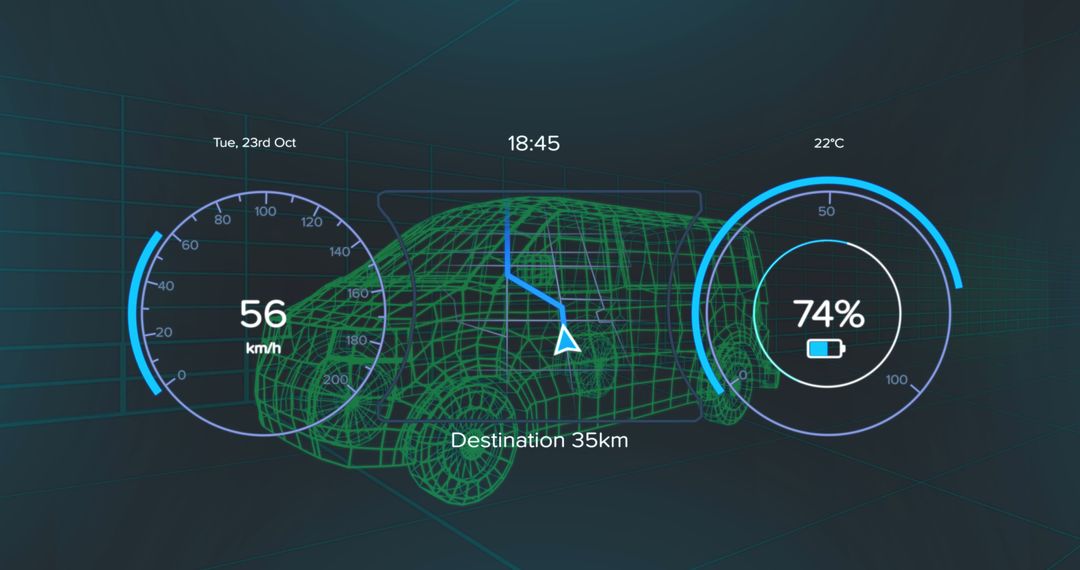
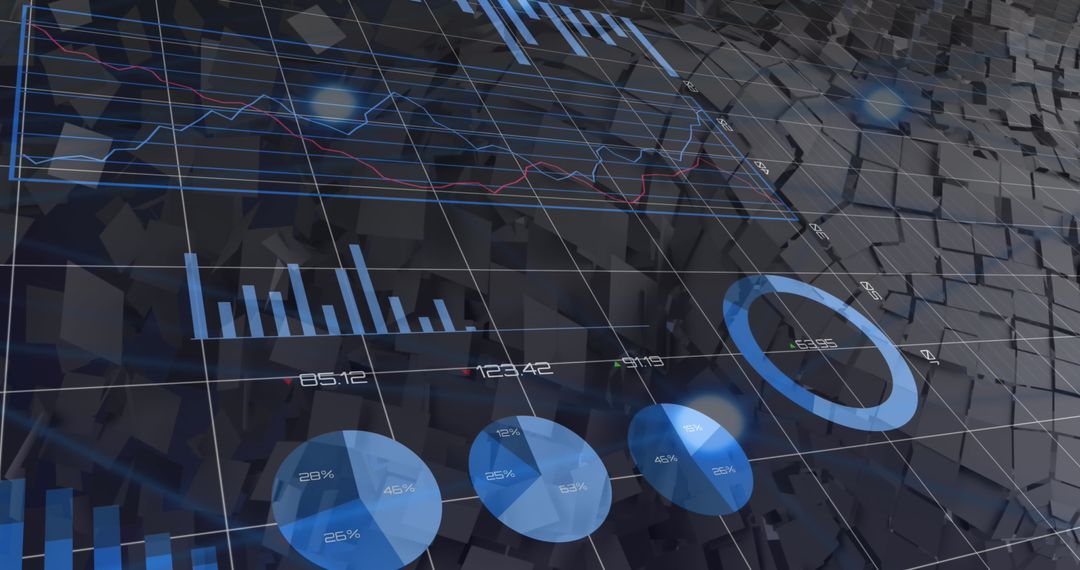
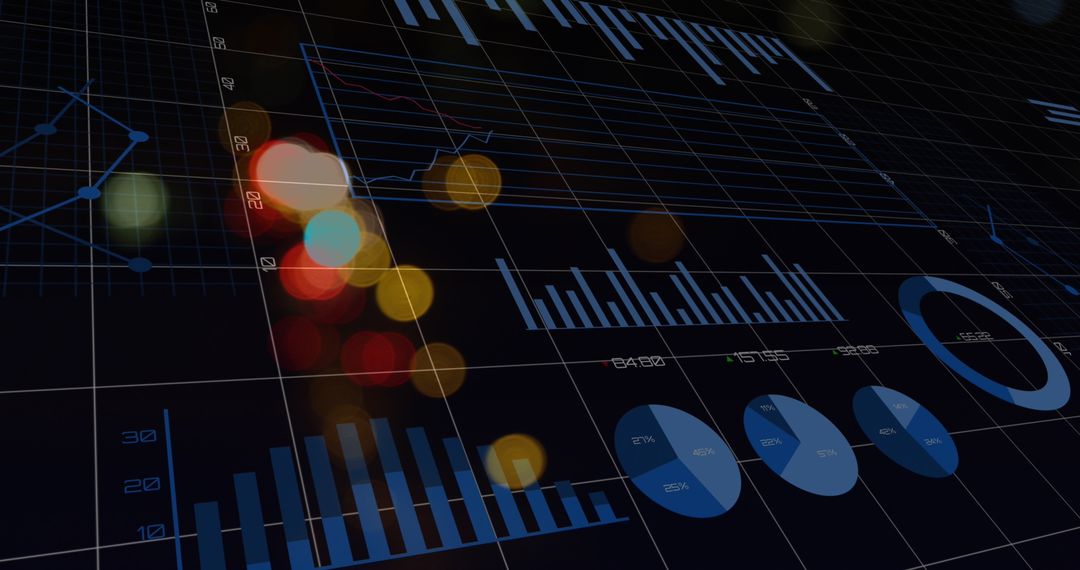
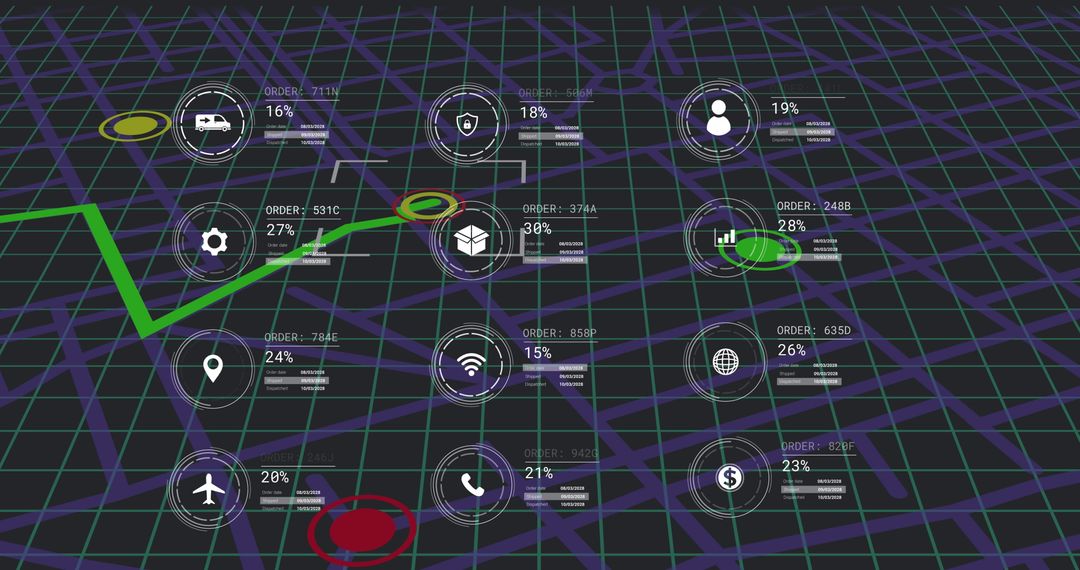
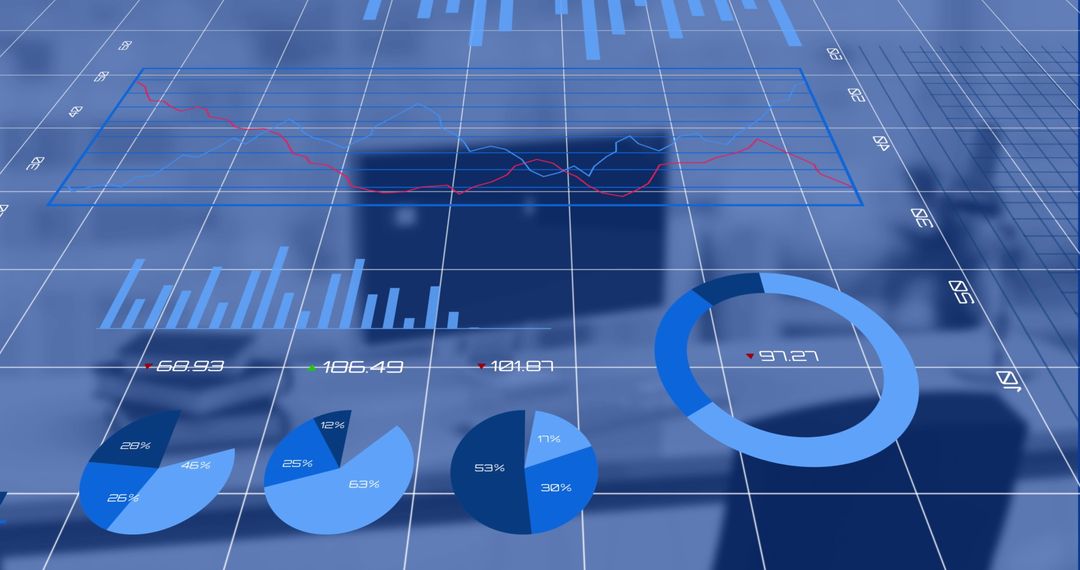
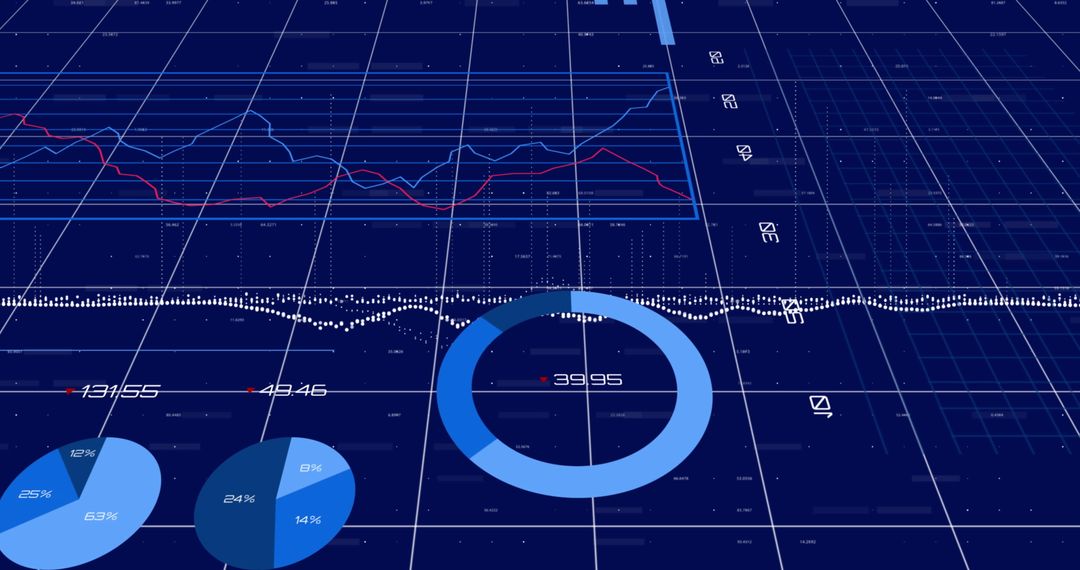
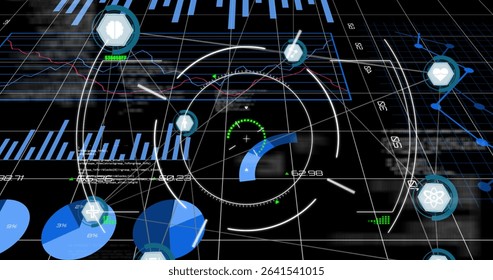
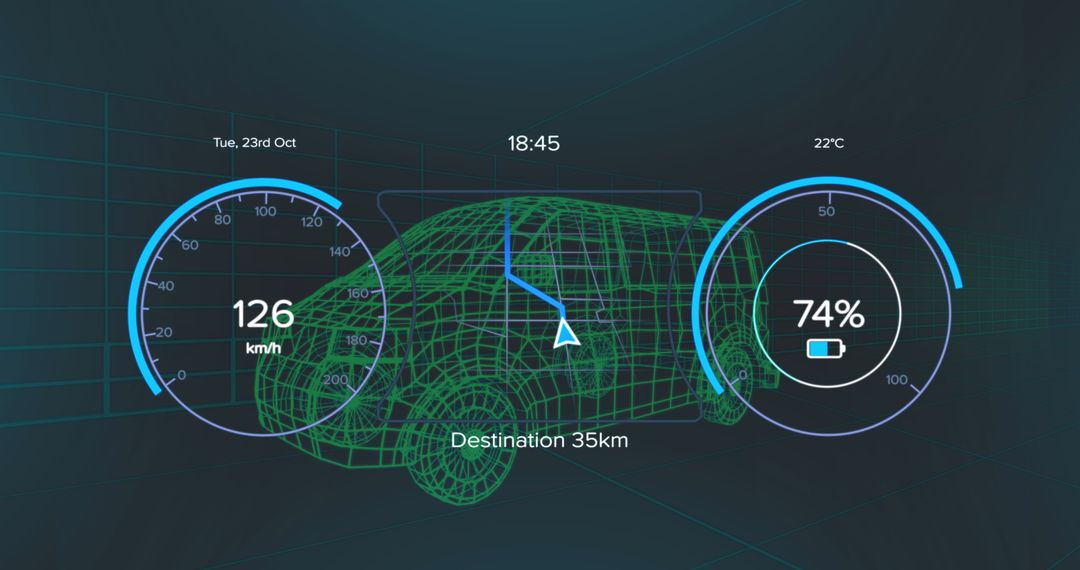
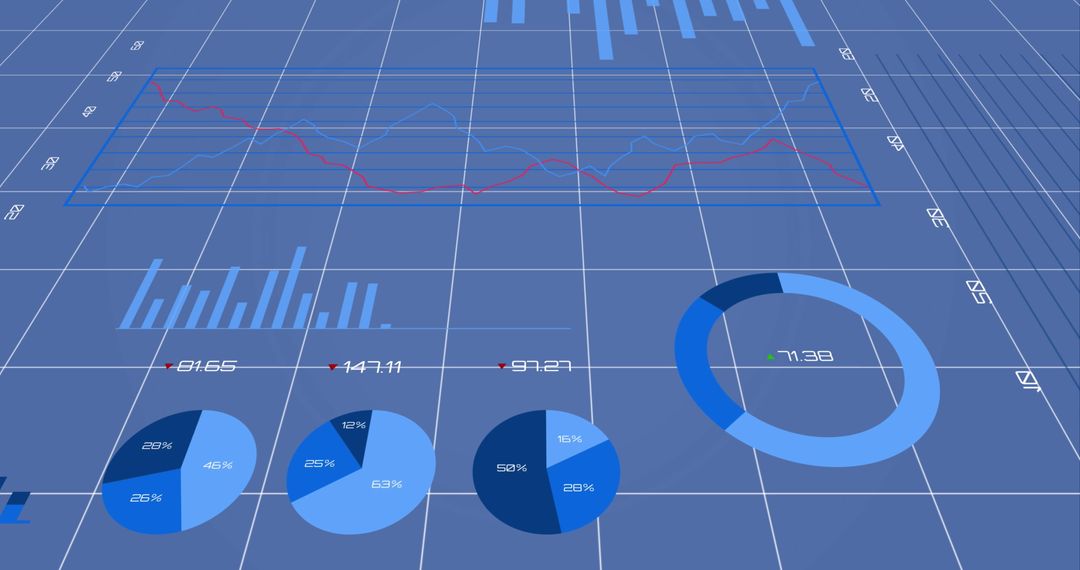
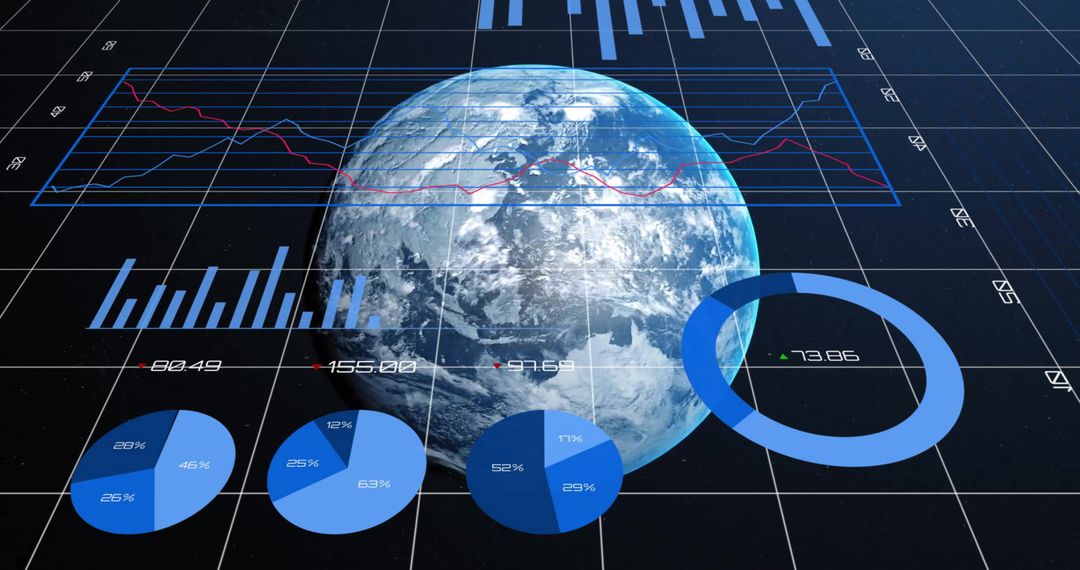
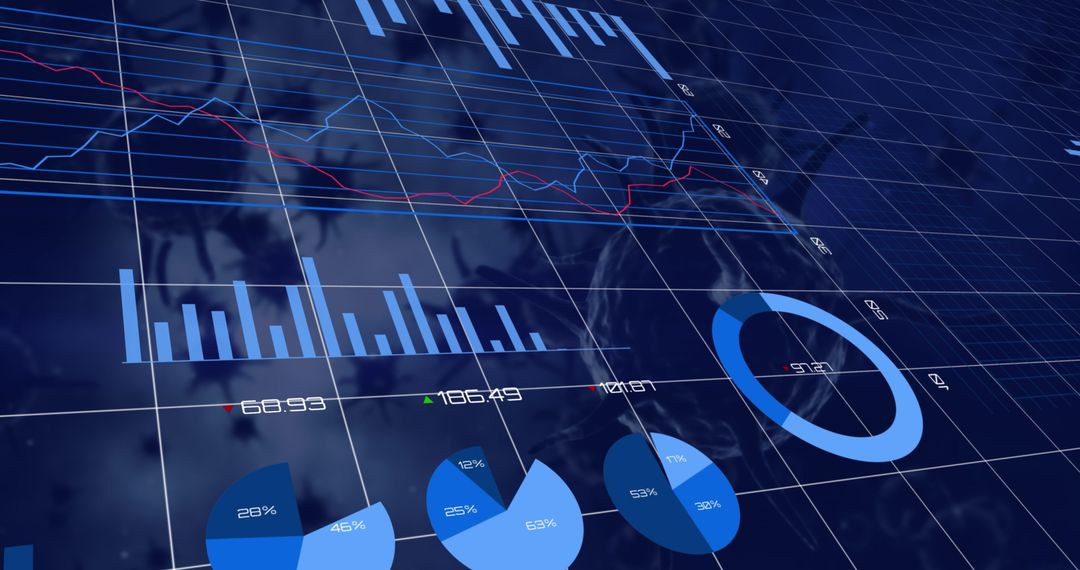
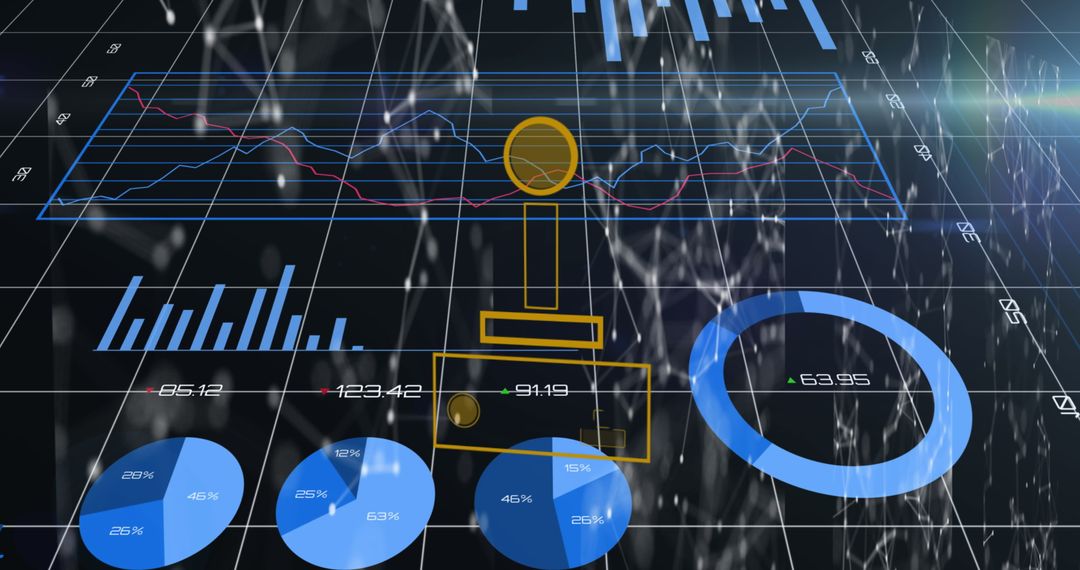
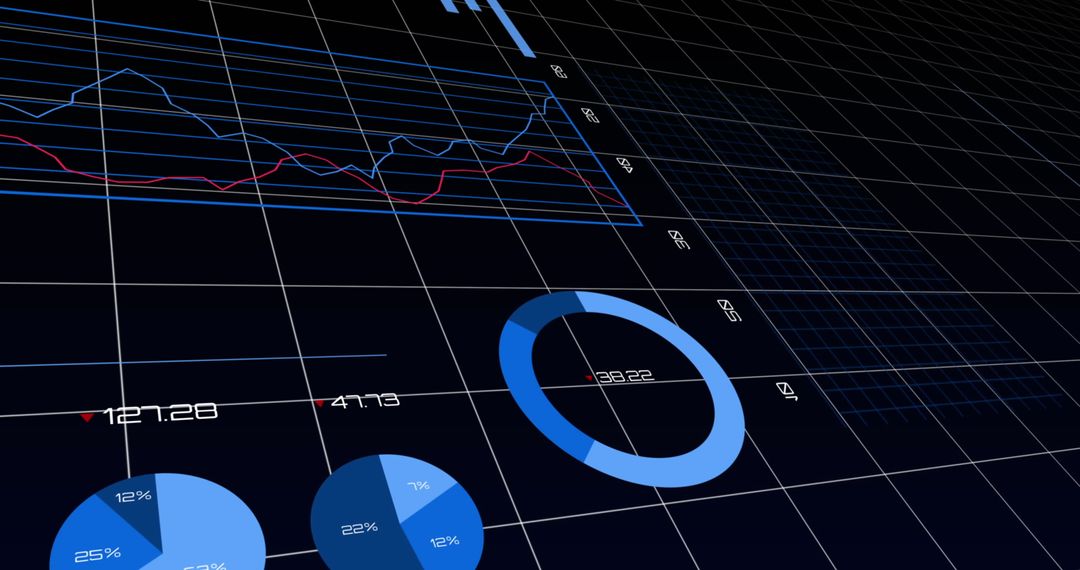
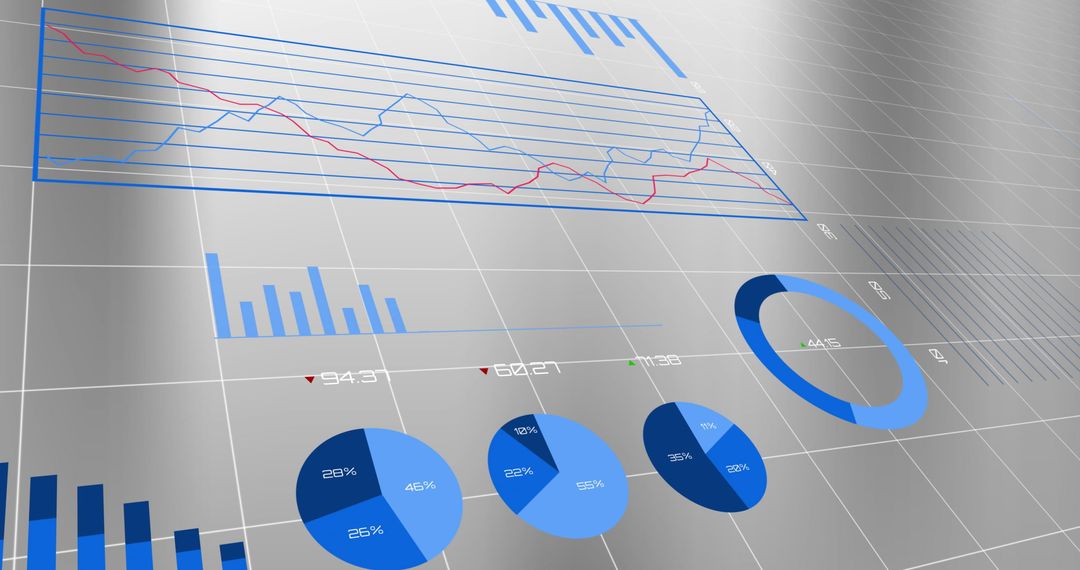
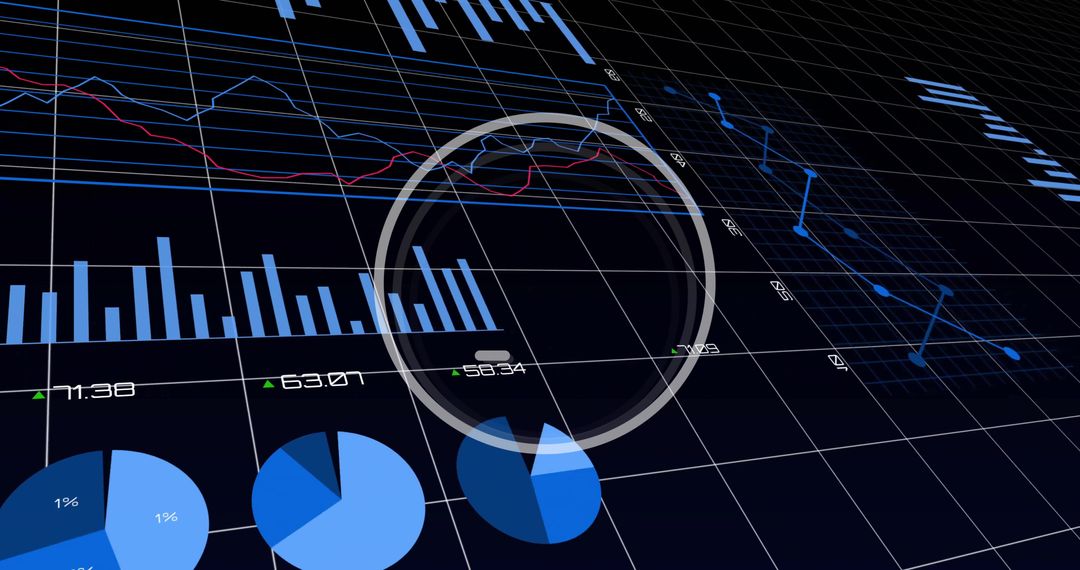
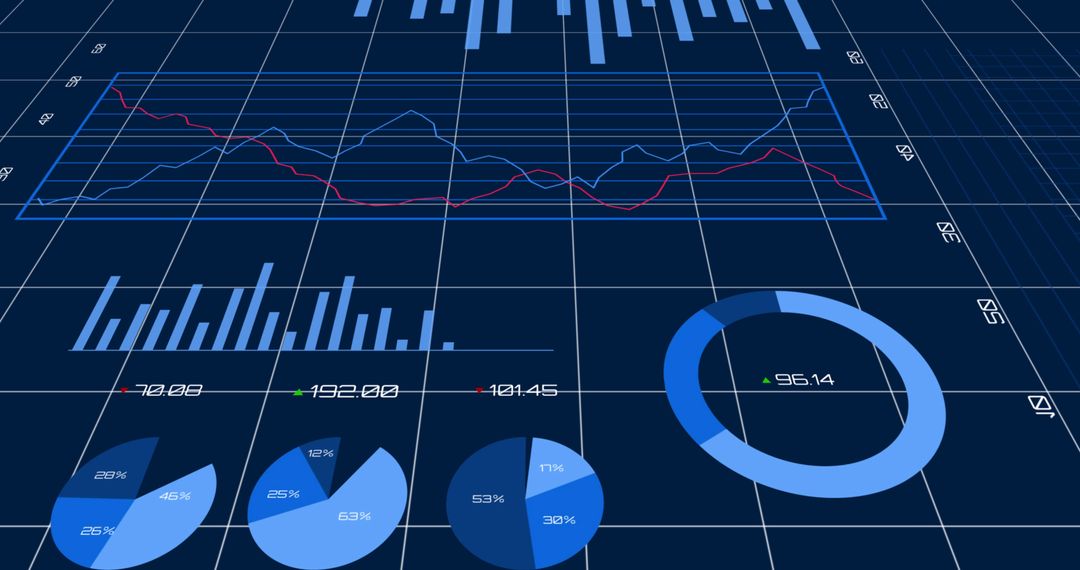
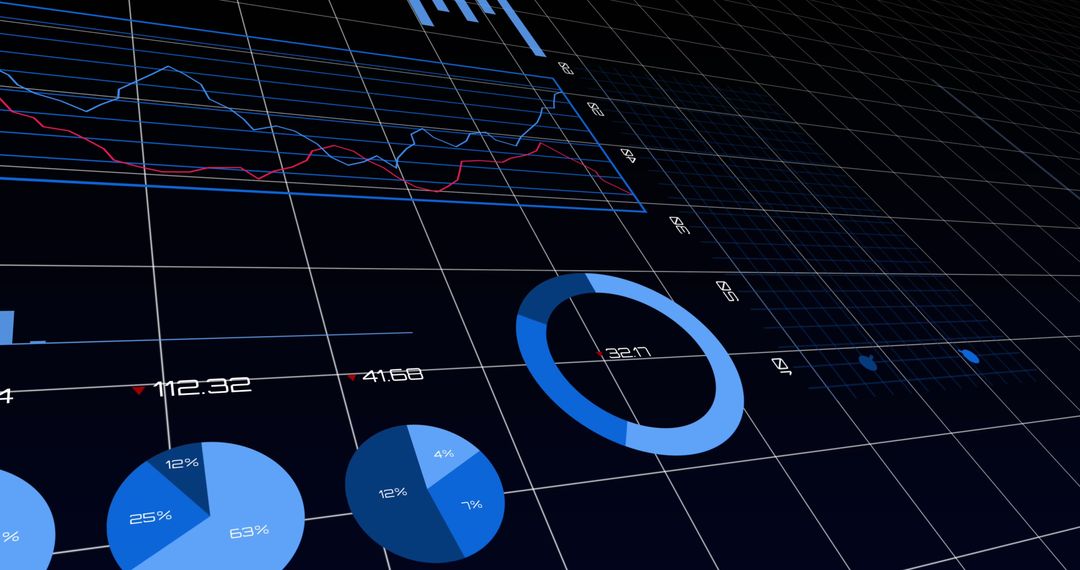
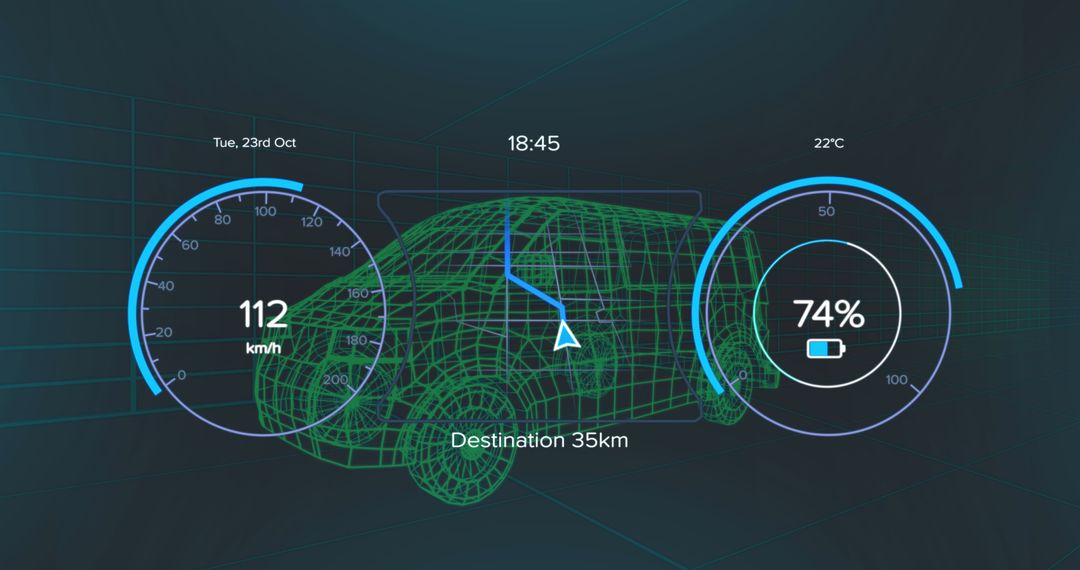
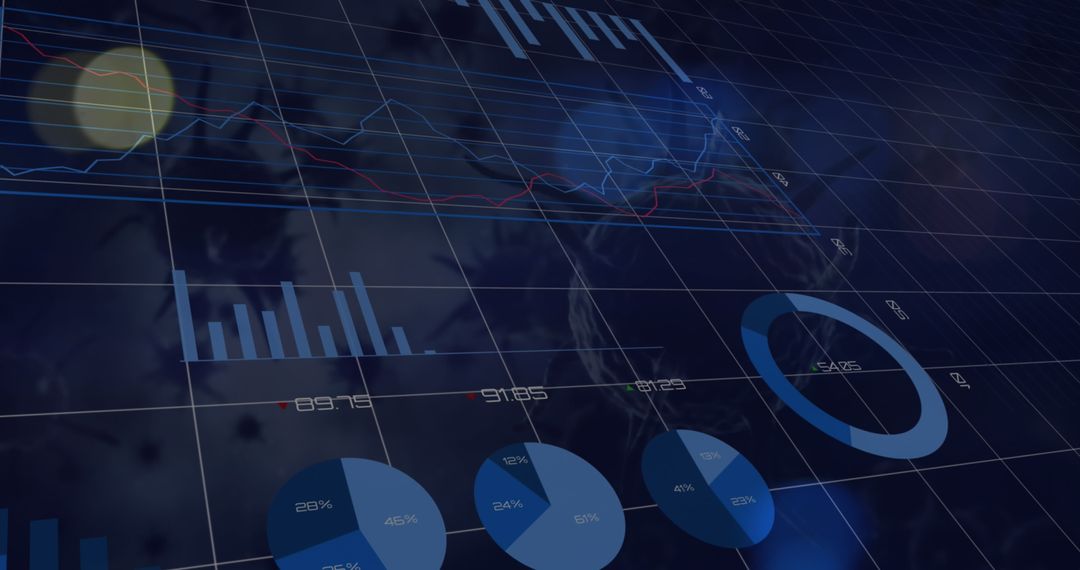
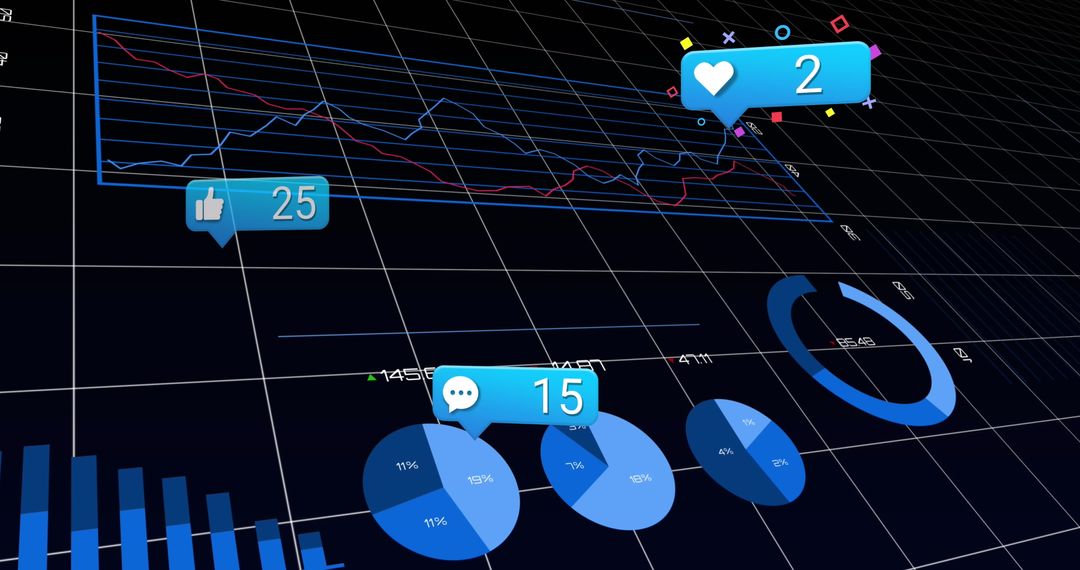
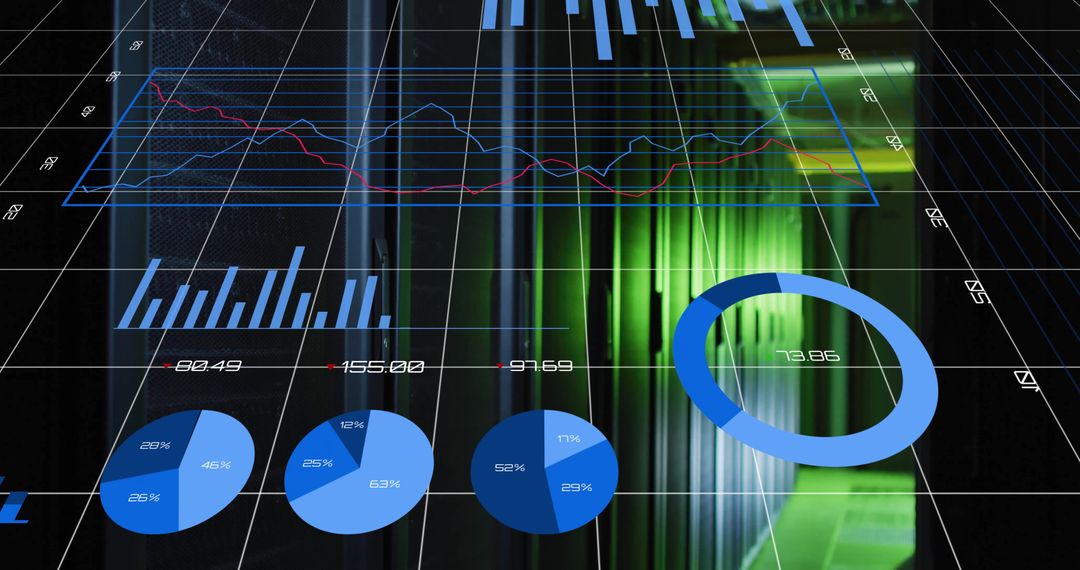
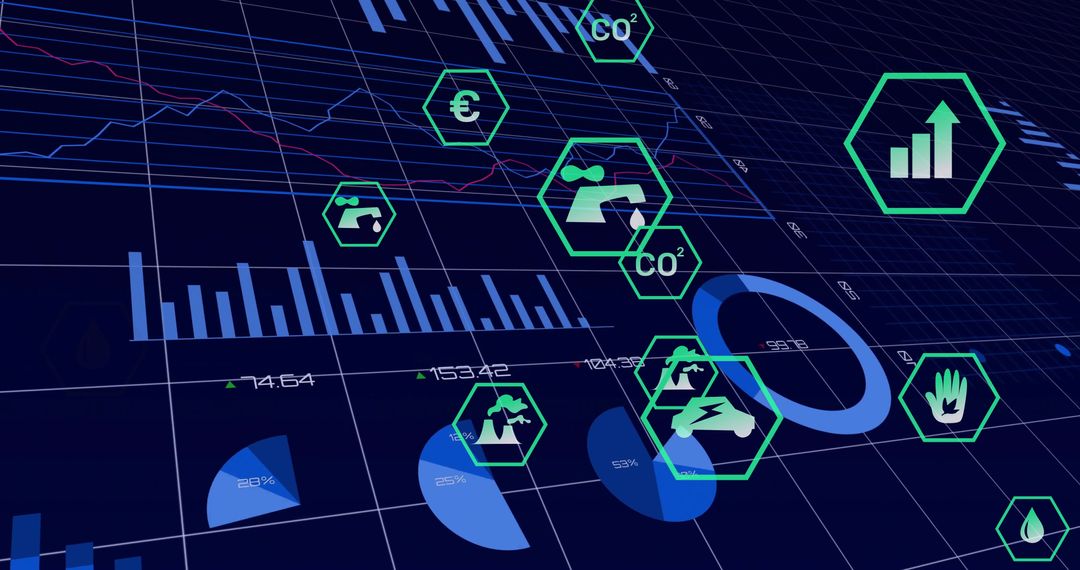
- Digital Dashboard Showing Energy and Sustainability Analytics
Digital Dashboard Showing Energy and Sustainability Analytics Image

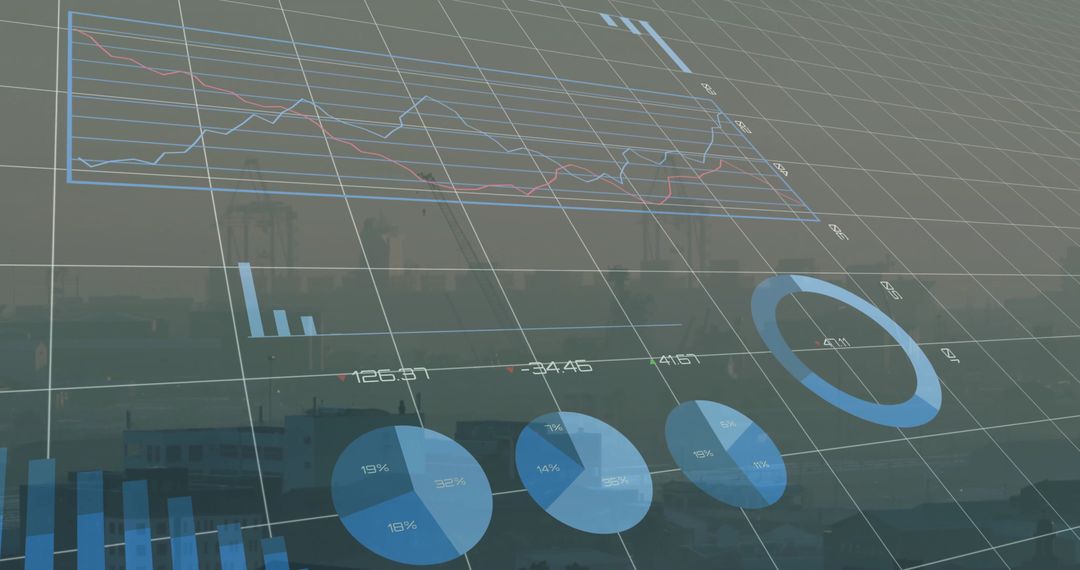
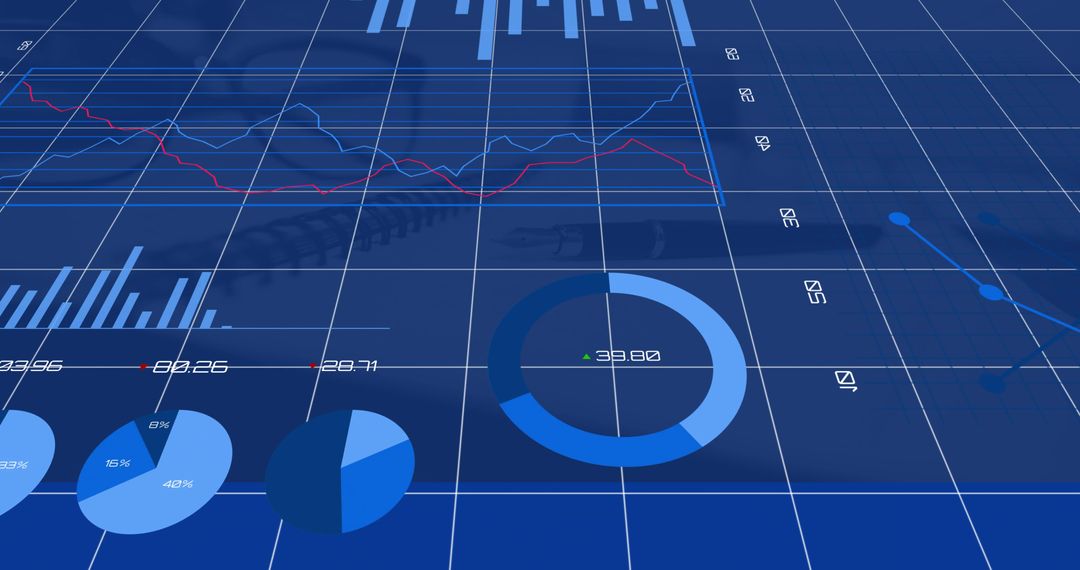
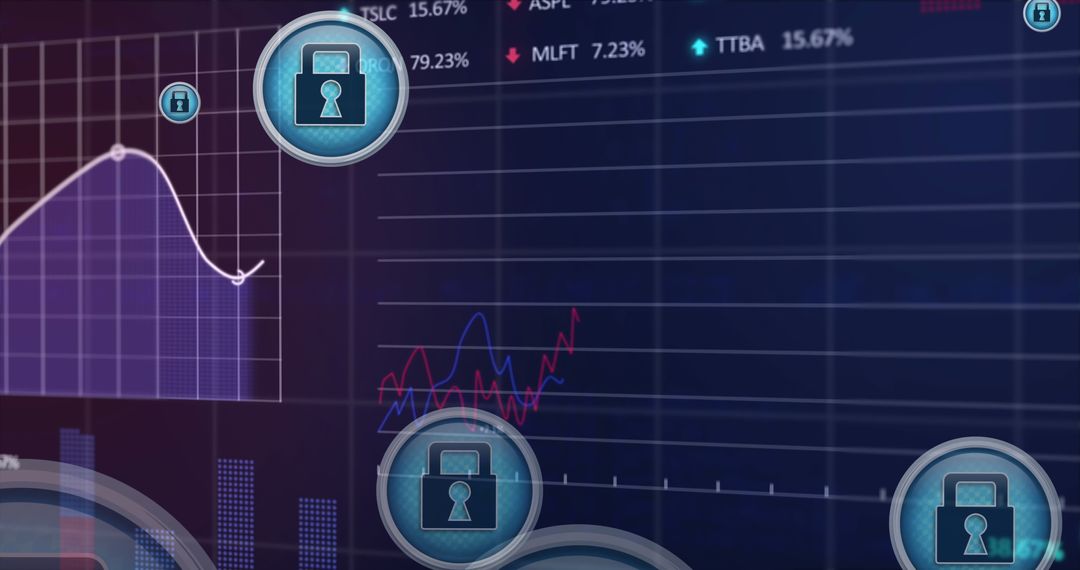
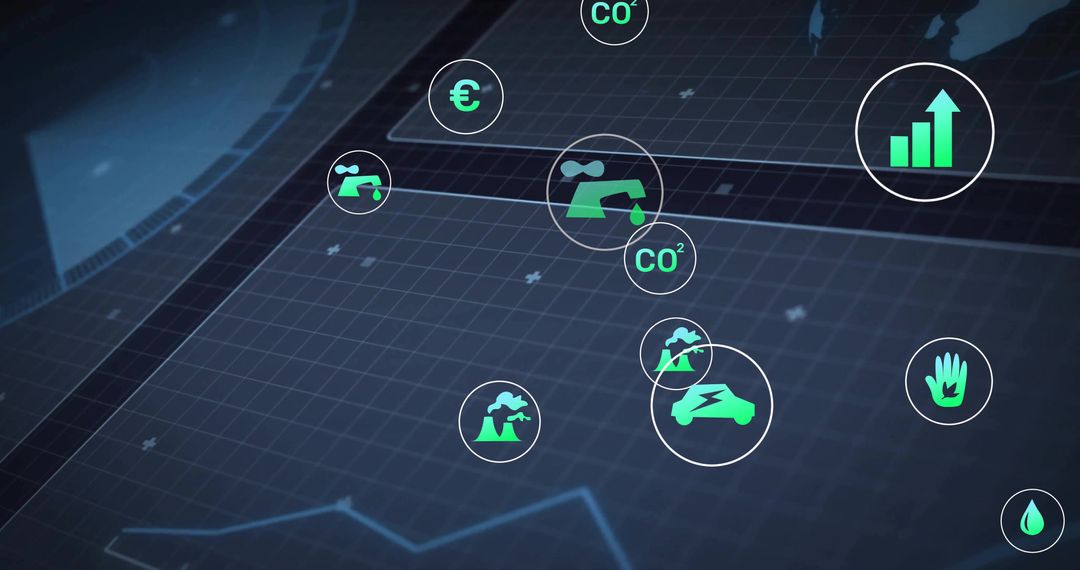
This image illustrates a digital dashboard that integrates various analytics components, including blue ring charts, pie charts, and line graphs, with symbols related to energy and sustainability. The green energy icons and overall design emphasize technological innovation and eco-conscious thinking. Suitable for use in presentations, articles, and marketing materials focused on green technology, environmental data analytics, and sustainable energy solutions.
Powered by  - Get 15% off with code: PIKWIZARD15


0
downloads
downloads
Tags:
More
Credit Photo
If you would like to credit the Photo, here are some ways you can do so
Text Link
photo Link
<span class="text-link">
<span>
<a target="_blank" href=https://pikwizard.com/photo/digital-dashboard-showing-energy-and-sustainability-analytics/936b72a3afa7f5e55ea4f82f037f7300/>PikWizard</a>
</span>
</span>
<span class="image-link">
<span
style="margin: 0 0 20px 0; display: inline-block; vertical-align: middle; width: 100%;"
>
<a
target="_blank"
href="https://pikwizard.com/photo/digital-dashboard-showing-energy-and-sustainability-analytics/936b72a3afa7f5e55ea4f82f037f7300/"
style="text-decoration: none; font-size: 10px; margin: 0;"
>
<img src="https://pikwizard.com/pw/medium/936b72a3afa7f5e55ea4f82f037f7300.jpg" style="margin: 0; width: 100%;" alt="" />
<p style="font-size: 12px; margin: 0;">PikWizard</p>
</a>
</span>
</span>
Free (free of charge)
Free for personal and commercial use.
Author: Creative Art
Similar Free Stock Images
Premium


Premium


Premium


Premium


Premium


Premium


Premium


Premium


Premium

Premium


Premium


Premium


Premium


Premium
Premium


Premium


Premium


Premium


Premium

Premium


Premium


Premium


Premium


Premium