- Home >
- Stock Photos >
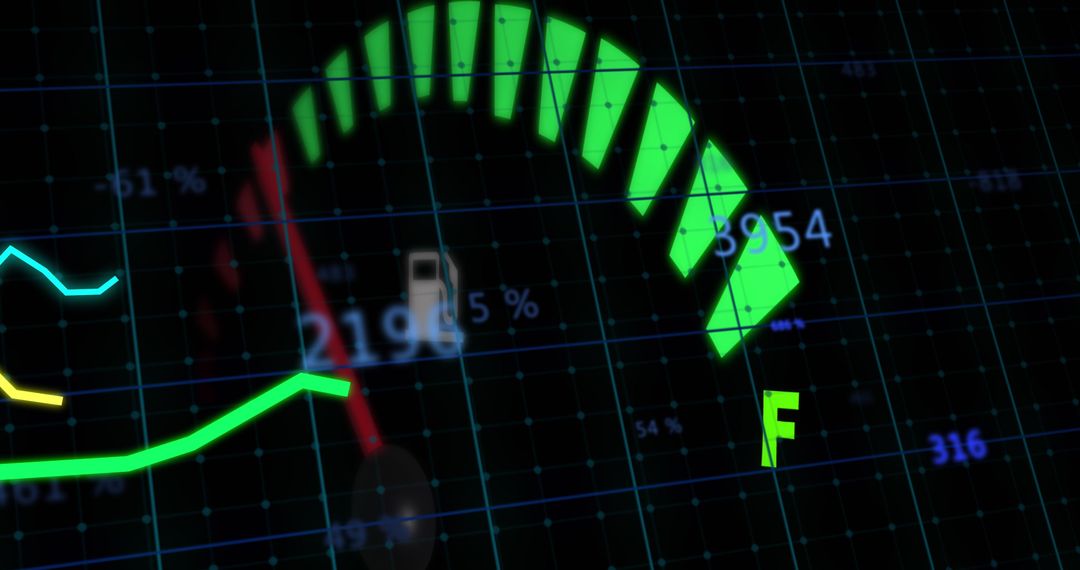
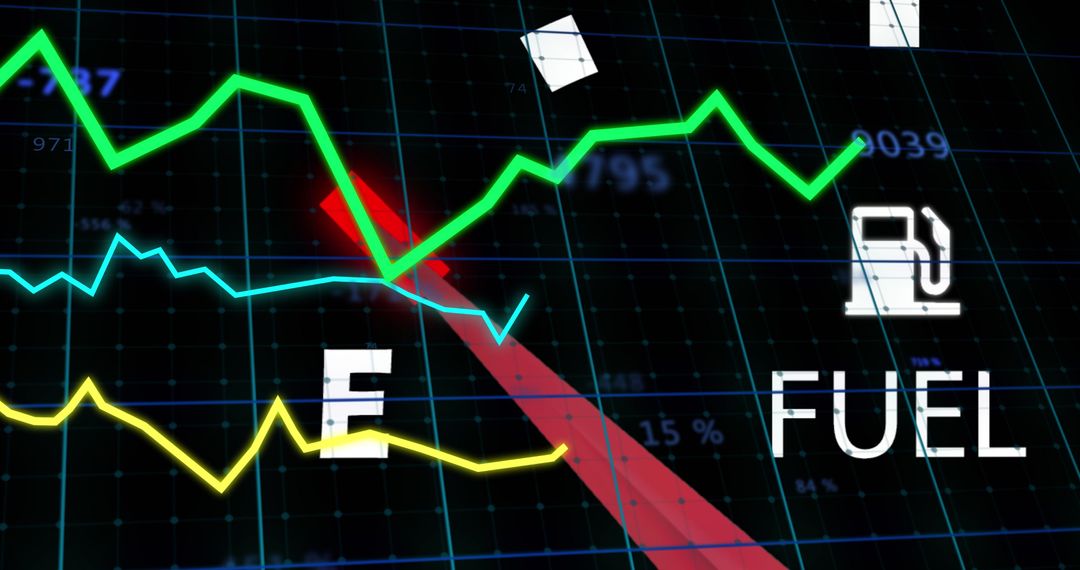
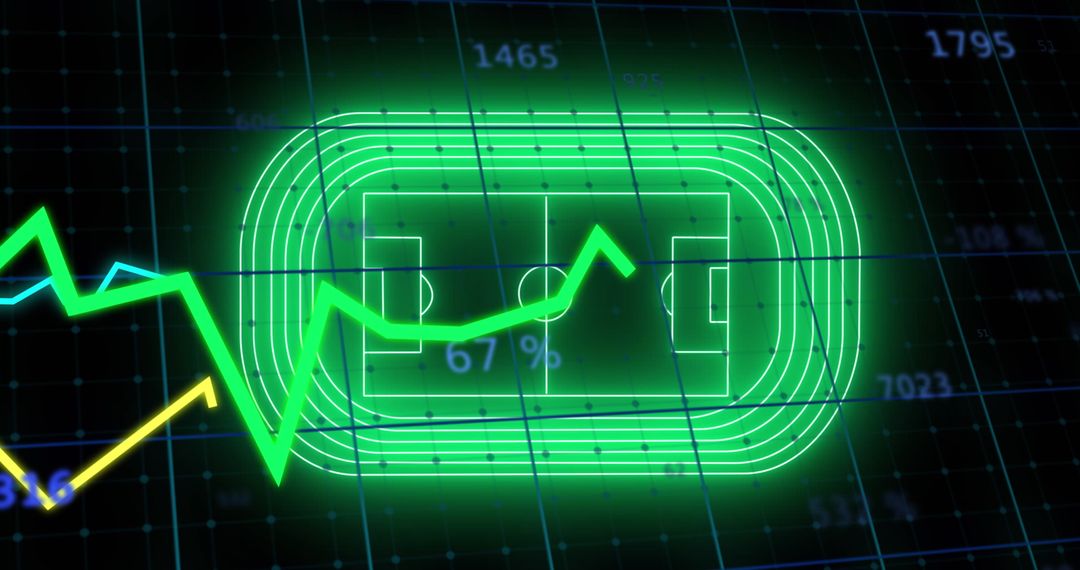
- Digital Dashboard Showing Financial Analysis with Graphs
Digital Dashboard Showing Financial Analysis with Graphs Image

Visuals showcase digital interface on car dashboard integrating financial analysis charts. Ideal for illustrating tech-enhanced finance solutions, economic monitoring, or business analytics in futuristic settings. Useful for fintech companies or marketing analysis tools.
Powered by  - Get 15% off with code: PIKWIZARD15


2
downloads
downloads
Tags:
More
Credit Photo
If you would like to credit the Photo, here are some ways you can do so
Text Link
photo Link
<span class="text-link">
<span>
<a target="_blank" href=https://pikwizard.com/photo/digital-dashboard-showing-financial-analysis-with-graphs/d1f12d3e70f814796d82c534d93f3793/>PikWizard</a>
</span>
</span>
<span class="image-link">
<span
style="margin: 0 0 20px 0; display: inline-block; vertical-align: middle; width: 100%;"
>
<a
target="_blank"
href="https://pikwizard.com/photo/digital-dashboard-showing-financial-analysis-with-graphs/d1f12d3e70f814796d82c534d93f3793/"
style="text-decoration: none; font-size: 10px; margin: 0;"
>
<img src="https://pikwizard.com/pw/medium/d1f12d3e70f814796d82c534d93f3793.jpg" style="margin: 0; width: 100%;" alt="" />
<p style="font-size: 12px; margin: 0;">PikWizard</p>
</a>
</span>
</span>
Free (free of charge)
Free for personal and commercial use.
Author: Awesome Content
Similar Free Stock Images

Premium


Premium


Premium


Premium


Premium


Premium


Premium


Premium


Premium


Premium


Premium


Premium


Premium


Premium


Premium


Premium


Premium


Premium


Premium


Premium


Premium


Premium


Premium


Premium