
- Home >
- Stock Photos >
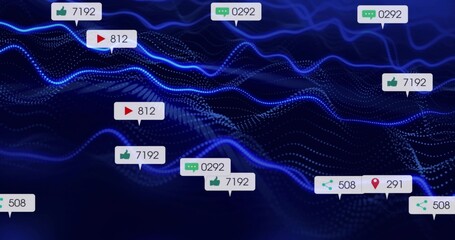
- Digital Dashboard Showing Like Count with Red Graph Visualization
Digital Dashboard Showing Like Count with Red Graph Visualization Image

This image beautifully portrays a digital like counter within a modern interface, ideal for illustrating concepts related to social media engagement and data analysis presentations. The red bars and line graph enhance the message of tracking and measuring trends, perfect for websites, blogs, or educational material on technology and digital marketing analytics.
Powered by 


downloads
Tags:
More
Credit Photo
If you would like to credit the Photo, here are some ways you can do so
Text Link
photo Link
<span class="text-link">
<span>
<a target="_blank" href=https://pikwizard.com/photo/digital-dashboard-showing-like-count-with-red-graph-visualization/0cc1e0ed17bd0969a1d4e224d2f5a62e/>PikWizard</a>
</span>
</span>
<span class="image-link">
<span
style="margin: 0 0 20px 0; display: inline-block; vertical-align: middle; width: 100%;"
>
<a
target="_blank"
href="https://pikwizard.com/photo/digital-dashboard-showing-like-count-with-red-graph-visualization/0cc1e0ed17bd0969a1d4e224d2f5a62e/"
style="text-decoration: none; font-size: 10px; margin: 0;"
>
<img src="https://pikwizard.com/pw/medium/0cc1e0ed17bd0969a1d4e224d2f5a62e.jpg" style="margin: 0; width: 100%;" alt="" />
<p style="font-size: 12px; margin: 0;">PikWizard</p>
</a>
</span>
</span>
Free (free of charge)
Free for personal and commercial use.
Author: Creative Art
Similar Free Stock Images

Premium


Premium


Premium


Premium


Premium

Premium


Premium

Premium


Premium


Premium


Premium


Premium


Premium


Premium


Premium


Premium


Premium


Premium


Premium


Premium


Premium


Premium

Premium


Premium


Premium


Explore More Free Stock Images