- Home >
- Stock Photos >
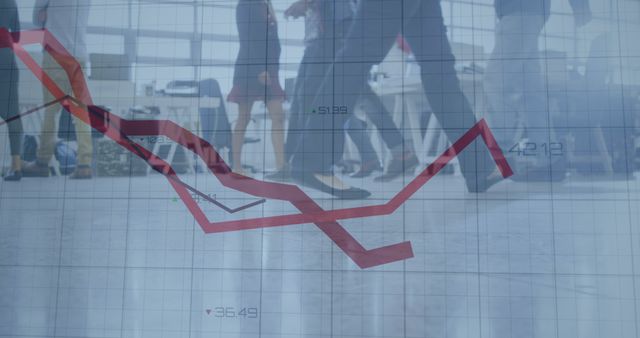
- Digital Dashboard Visualization of Declining Market Data Trends
Digital Dashboard Visualization of Declining Market Data Trends Image
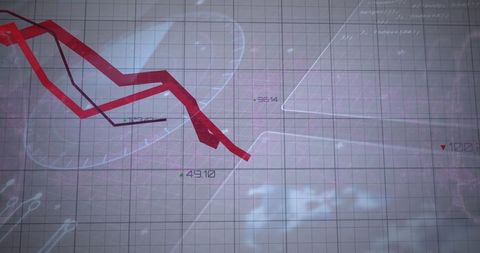
Image depicts a descending red trend line on a digital interface background, symbolizing decrease in financial markets or performance metrics. Ideal for illustrating business intelligence and data analytics presentations, articles on economic trends, or content focusing on financial technology innovation. Appeals to audiences interested in statistic forecasts and advanced visual dashboards.
Powered by  - Get 15% off with code: PIKWIZARD15


2
downloads
downloads
Tags:
More
Credit Photo
If you would like to credit the Photo, here are some ways you can do so
Text Link
photo Link
<span class="text-link">
<span>
<a target="_blank" href=https://pikwizard.com/photo/digital-dashboard-visualization-of-declining-market-data-trends/5a0e4b290ecffe763f81fd09d459e832/>PikWizard</a>
</span>
</span>
<span class="image-link">
<span
style="margin: 0 0 20px 0; display: inline-block; vertical-align: middle; width: 100%;"
>
<a
target="_blank"
href="https://pikwizard.com/photo/digital-dashboard-visualization-of-declining-market-data-trends/5a0e4b290ecffe763f81fd09d459e832/"
style="text-decoration: none; font-size: 10px; margin: 0;"
>
<img src="https://pikwizard.com/pw/medium/5a0e4b290ecffe763f81fd09d459e832.jpg" style="margin: 0; width: 100%;" alt="" />
<p style="font-size: 12px; margin: 0;">PikWizard</p>
</a>
</span>
</span>
Free (free of charge)
Free for personal and commercial use.
Author: Creative Art
Similar Free Stock Images

Premium


Premium


Premium


Premium


Premium


Premium


Premium


Premium


Premium