- Home >
- Stock Photos >
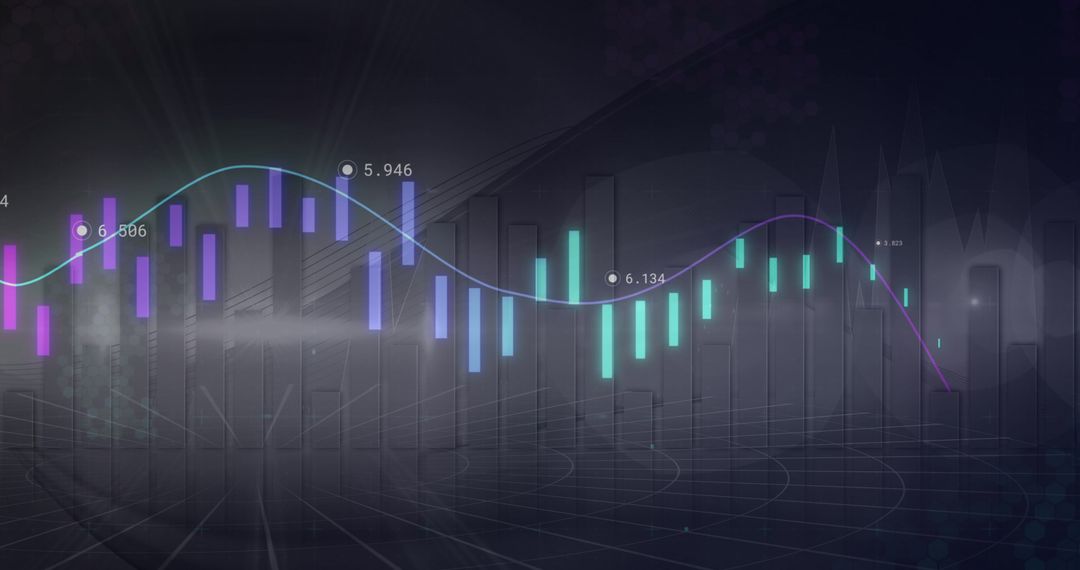
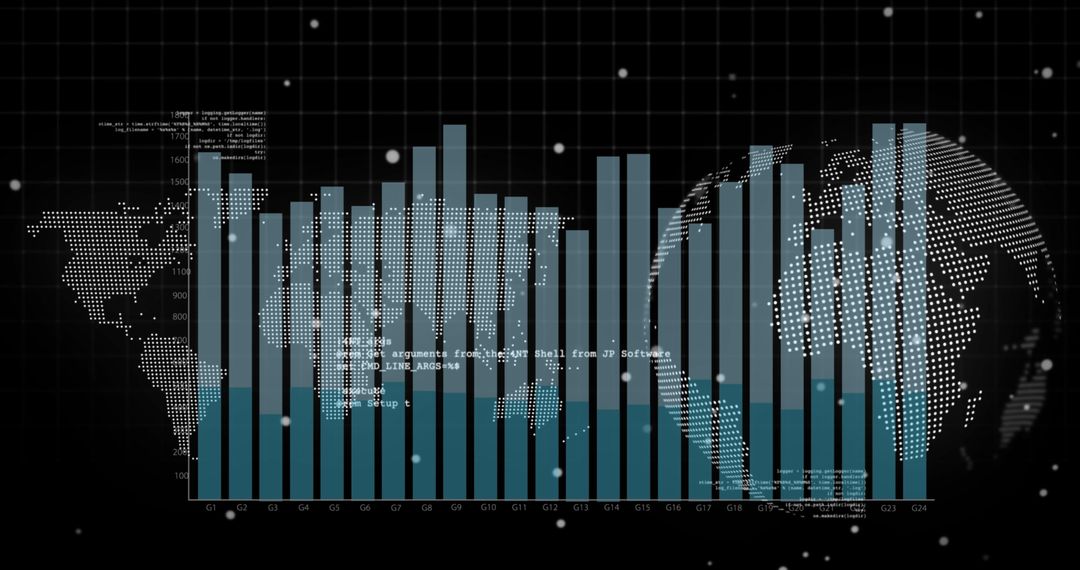
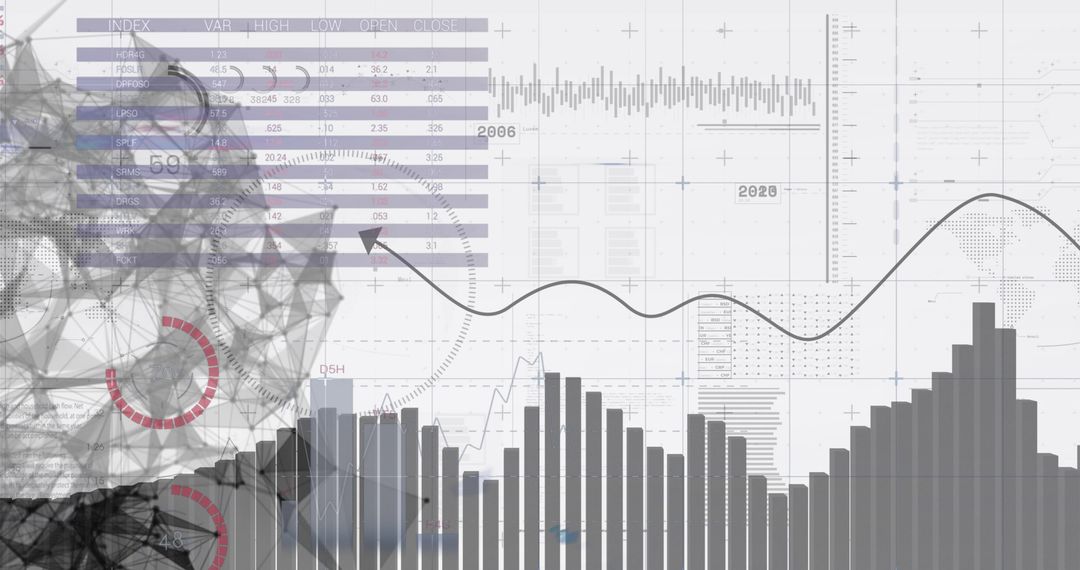
- Digital Dashboard with Bar Charts and World Map Overlay
Digital Dashboard with Bar Charts and World Map Overlay Image

Illustrates a concept of advanced data analytics with elements including bar charts and world map on digital dashboard. Ideal for technology blogs, data science articles, presentations on big data, and materials focused on information technology development. Can be used to convey themes of innovation, global analytics, and modern data processing.
Powered by  - Get 15% off with code: PIKWIZARD15


0
downloads
downloads
Tags:
More
Credit Photo
If you would like to credit the Photo, here are some ways you can do so
Text Link
photo Link
<span class="text-link">
<span>
<a target="_blank" href=https://pikwizard.com/photo/digital-dashboard-with-bar-charts-and-world-map-overlay/07af02a4e91caf1a6c9d14a67eb1e8db/>PikWizard</a>
</span>
</span>
<span class="image-link">
<span
style="margin: 0 0 20px 0; display: inline-block; vertical-align: middle; width: 100%;"
>
<a
target="_blank"
href="https://pikwizard.com/photo/digital-dashboard-with-bar-charts-and-world-map-overlay/07af02a4e91caf1a6c9d14a67eb1e8db/"
style="text-decoration: none; font-size: 10px; margin: 0;"
>
<img src="https://pikwizard.com/pw/medium/07af02a4e91caf1a6c9d14a67eb1e8db.jpg" style="margin: 0; width: 100%;" alt="" />
<p style="font-size: 12px; margin: 0;">PikWizard</p>
</a>
</span>
</span>
Free (free of charge)
Free for personal and commercial use.
Author: Creative Art
Similar Free Stock Images

Premium


Premium


Premium


Premium


Premium


Premium


Premium


Premium


Premium


Premium


Premium


Premium


Premium


Premium


Premium


Premium


Premium


Premium


Premium


Premium


Premium


Premium


Premium


Premium