- Home >
- Stock Photos >
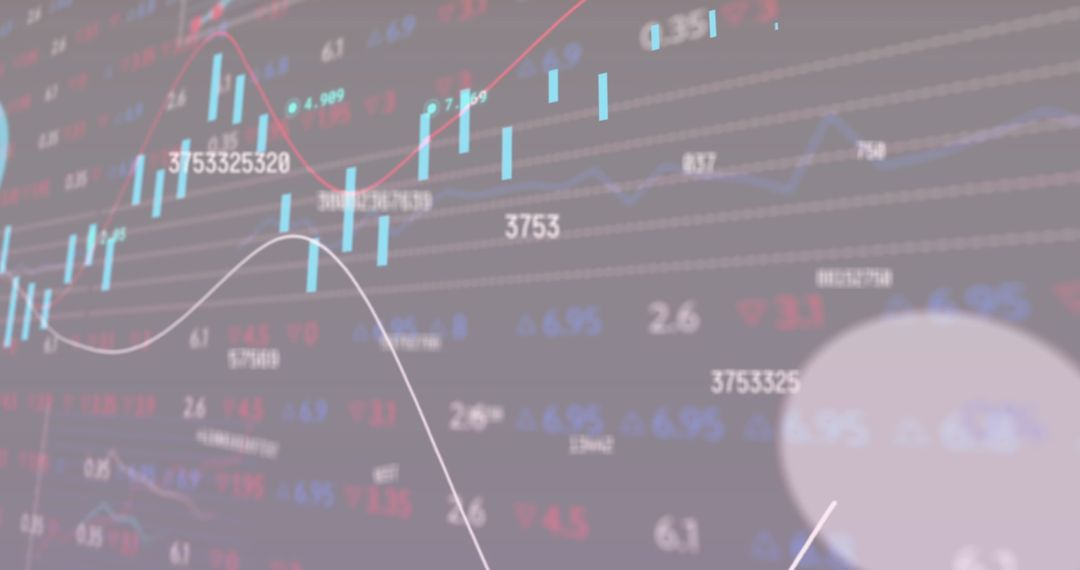
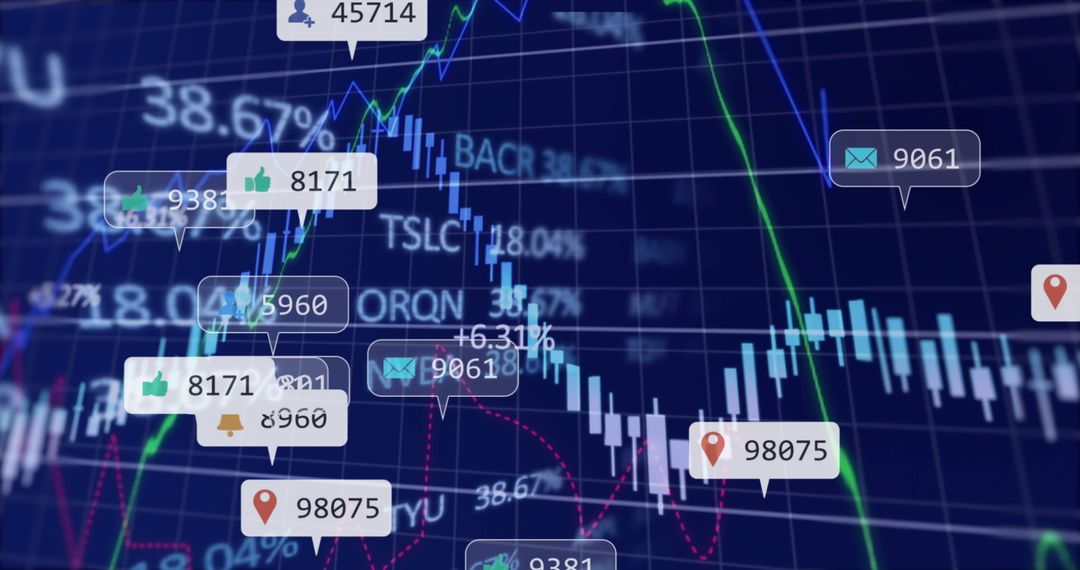
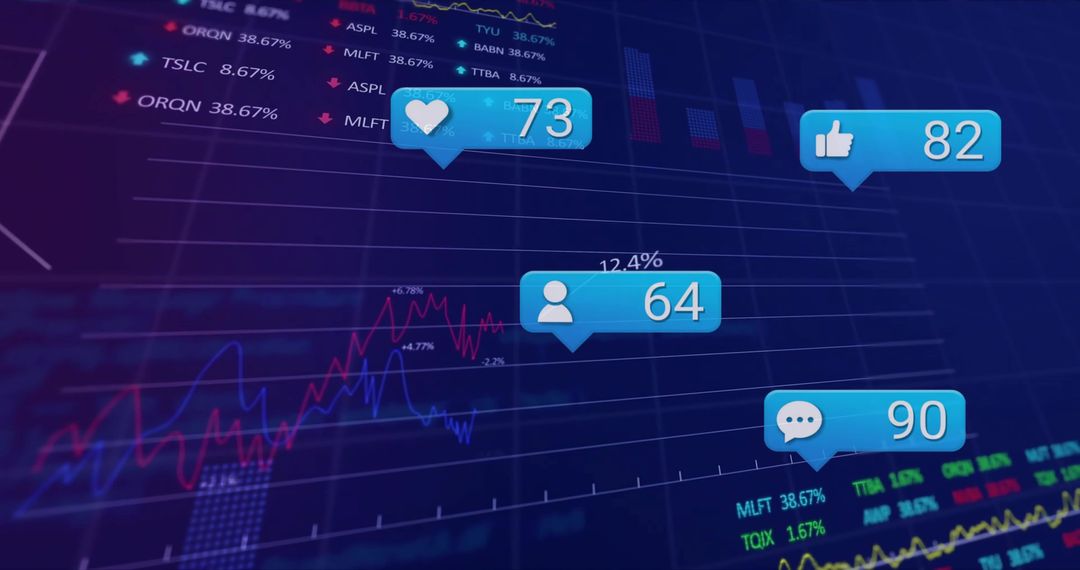
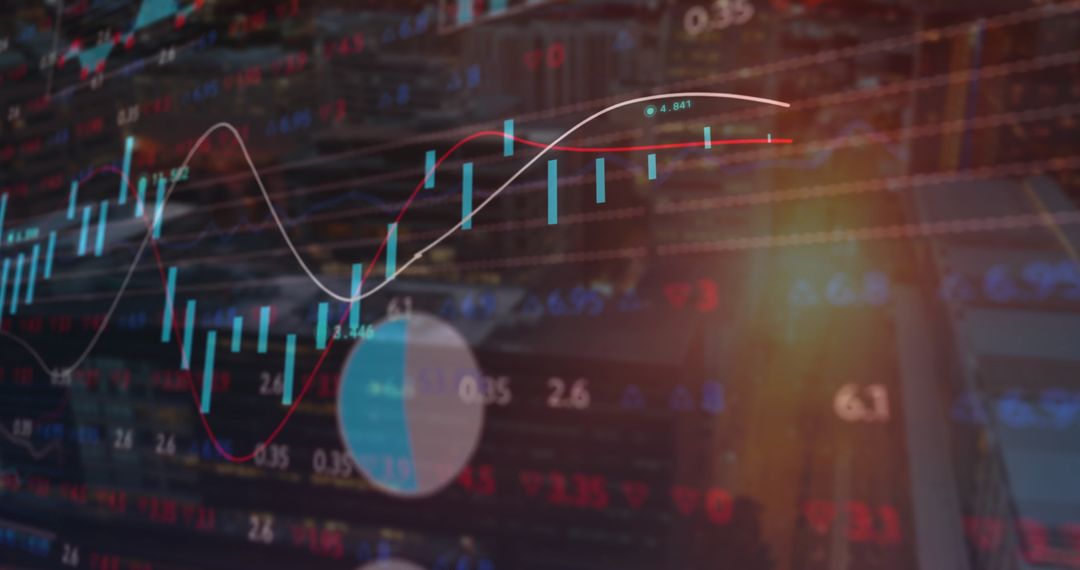
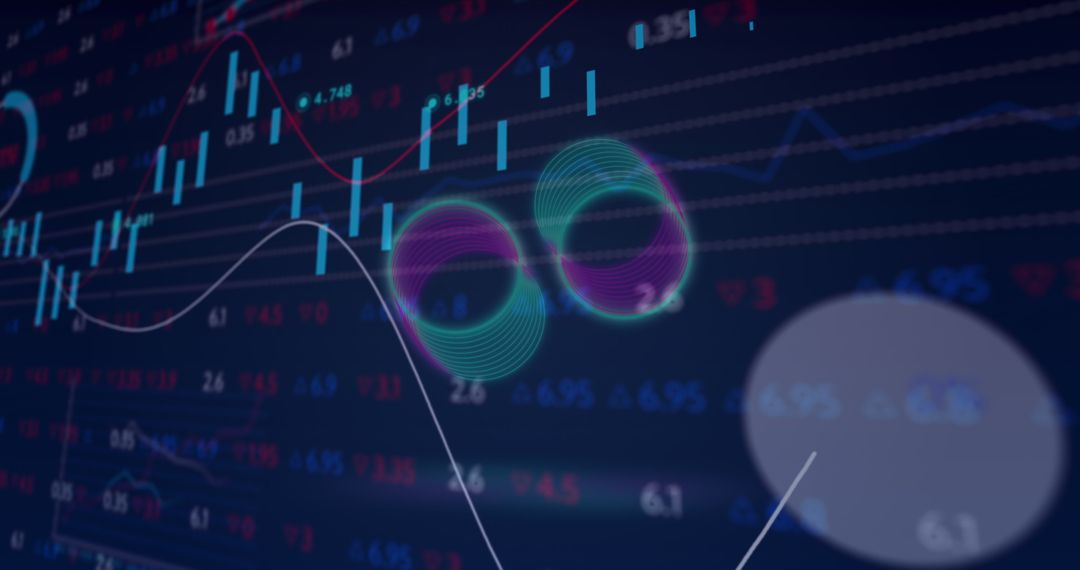
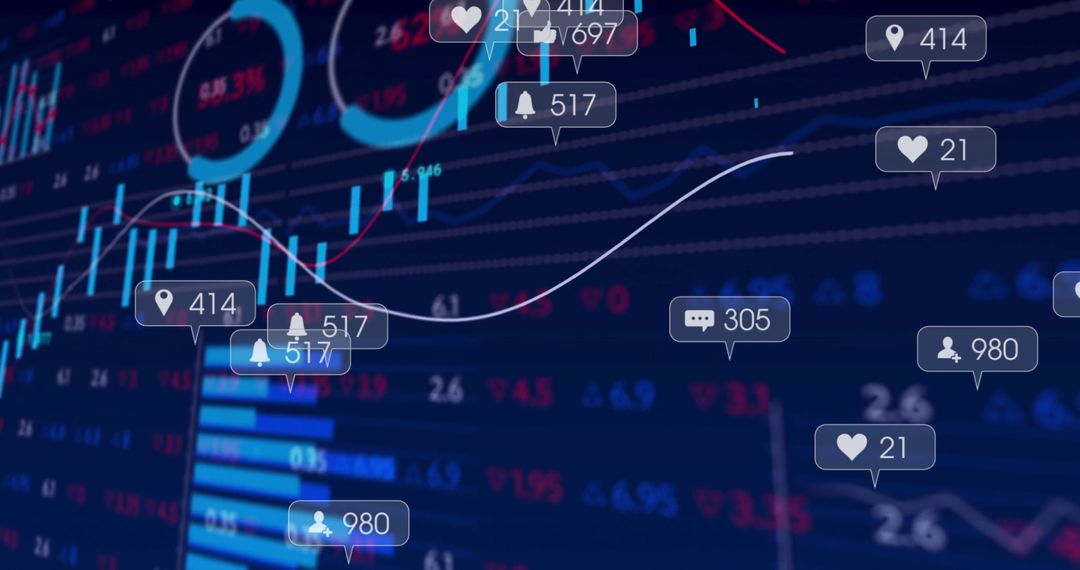
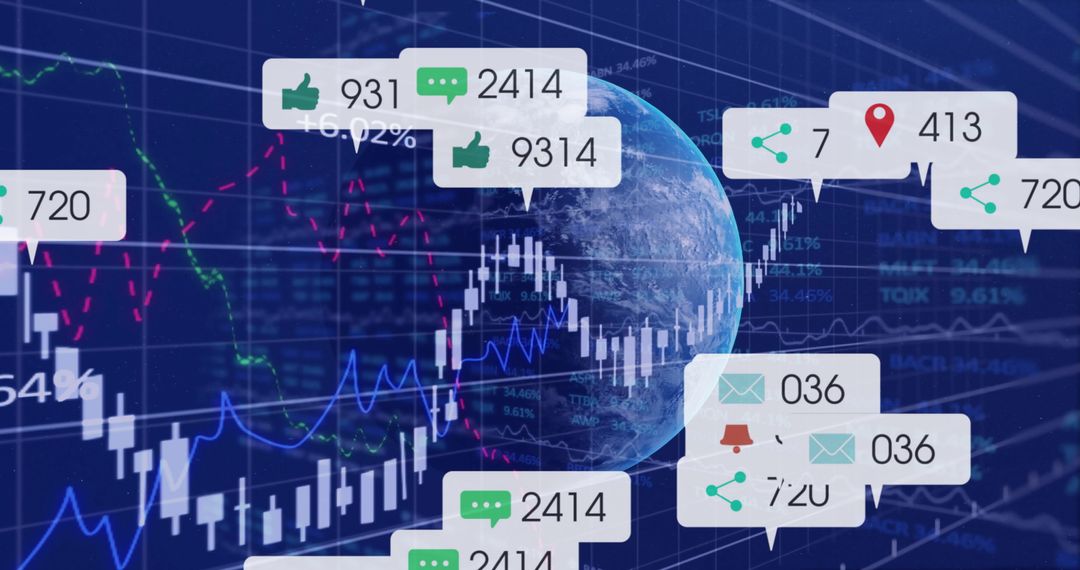
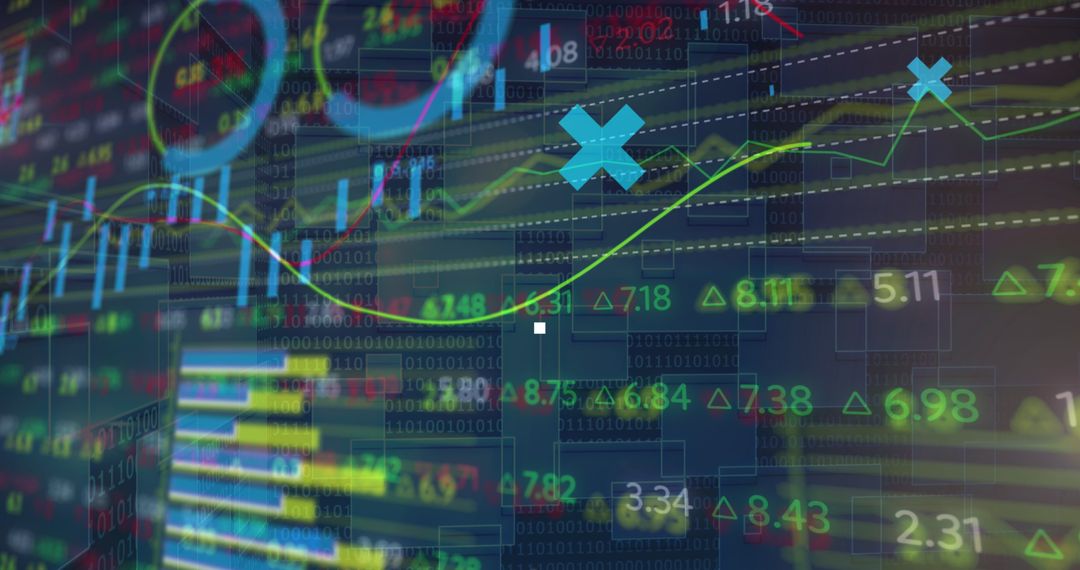
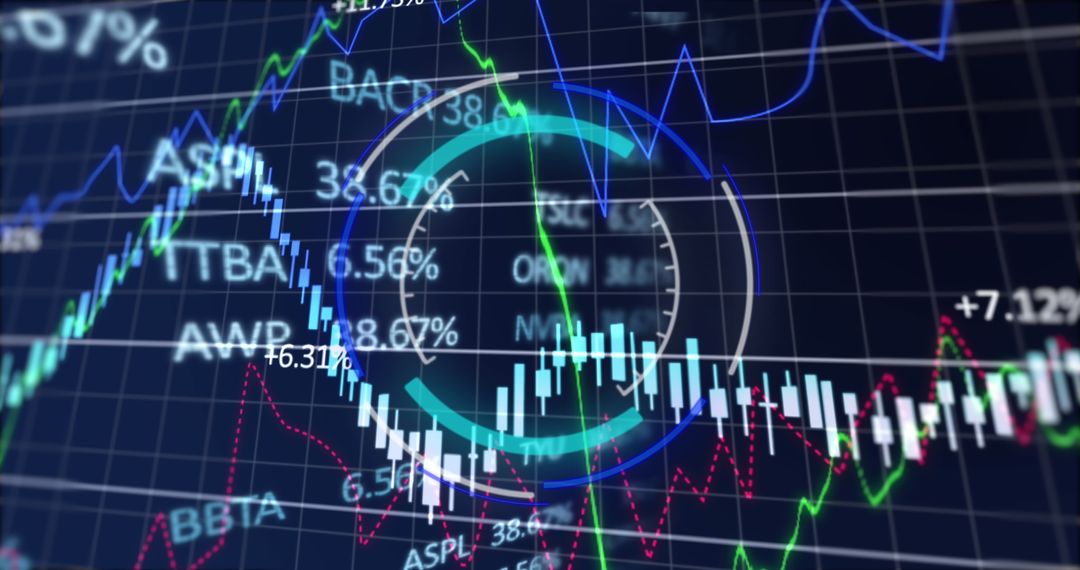
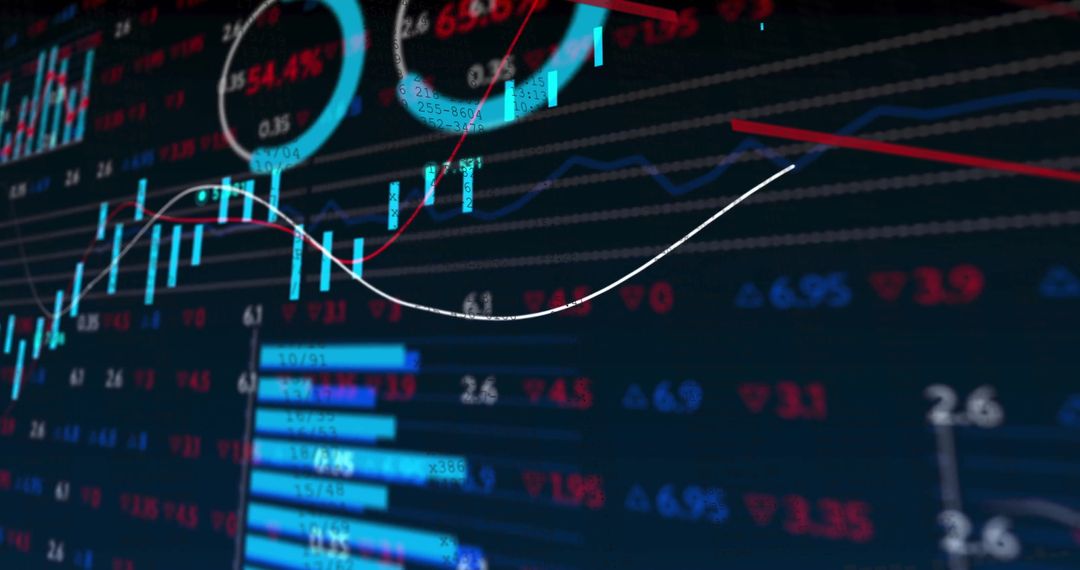
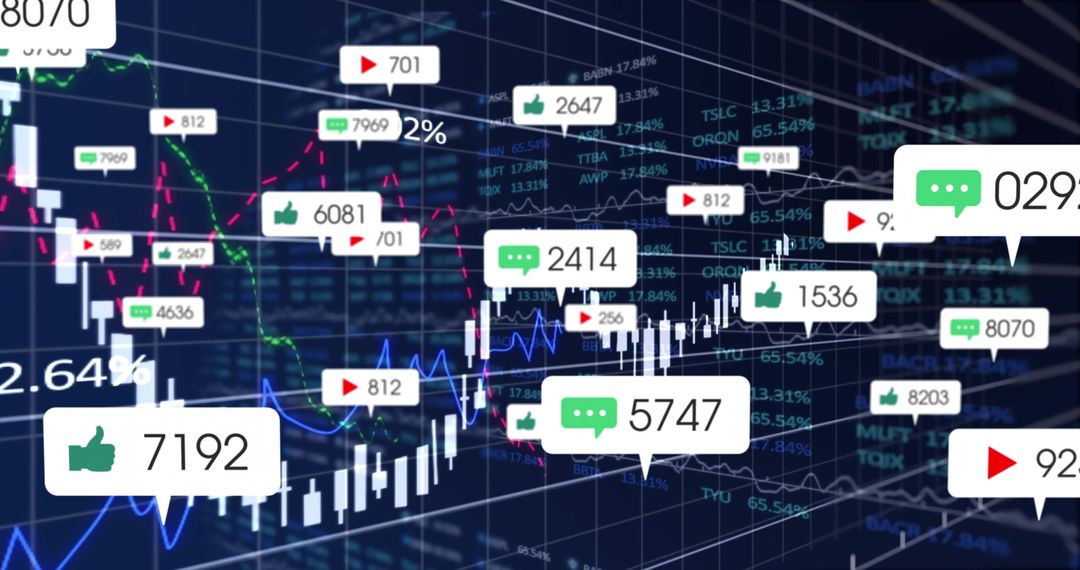
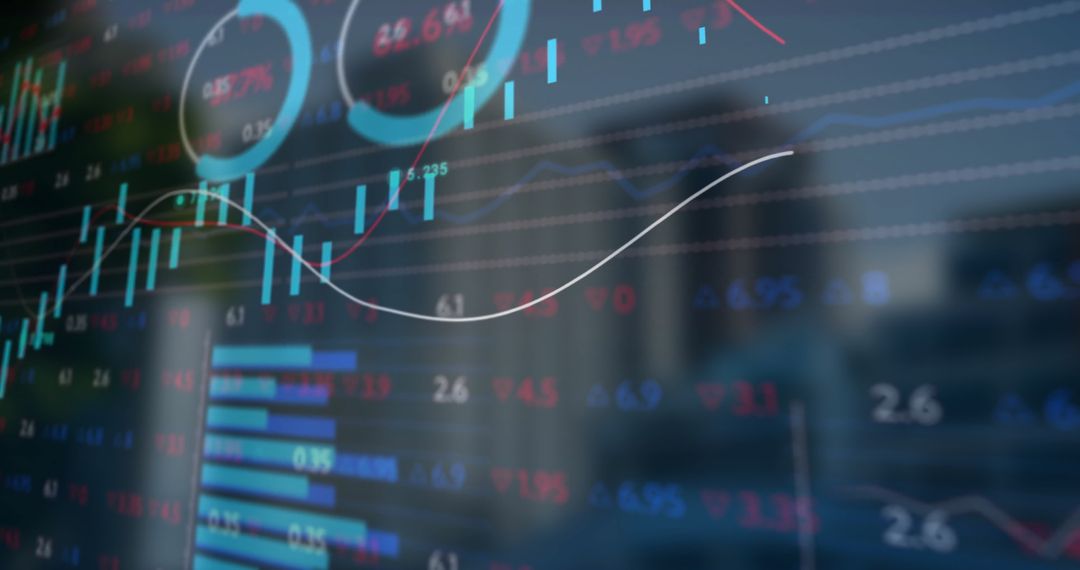
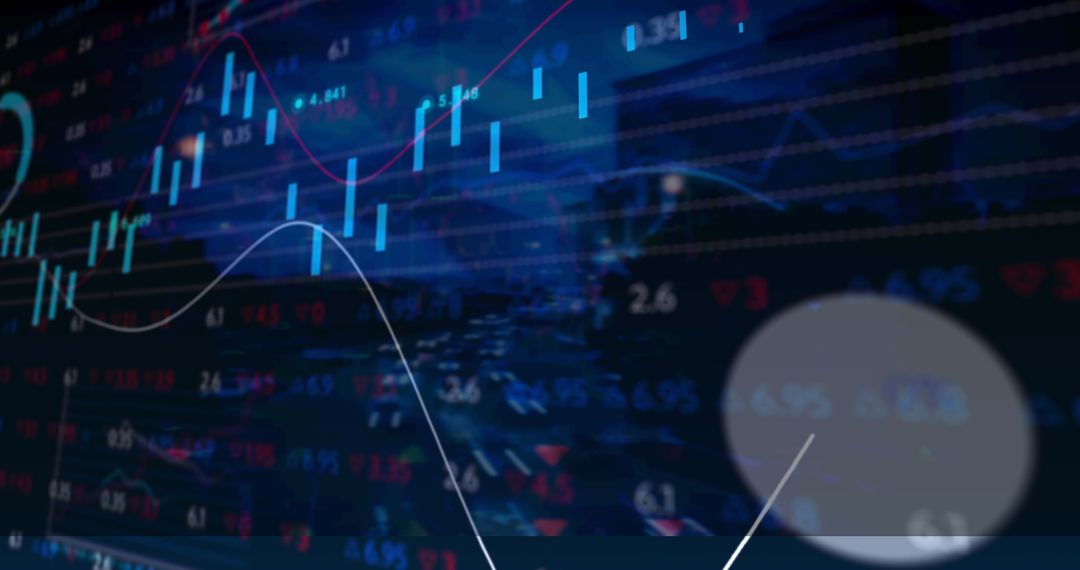
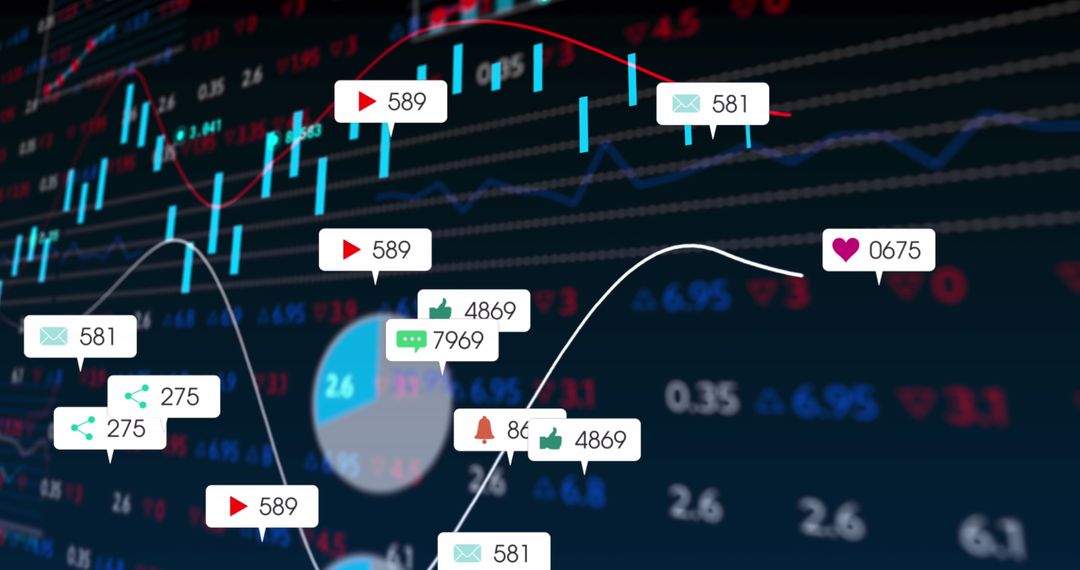
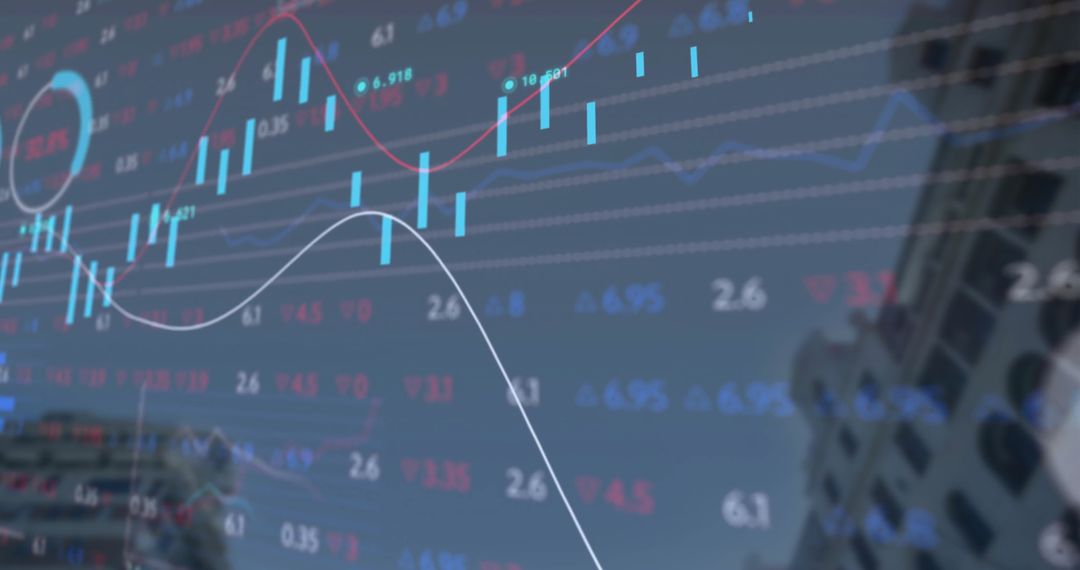
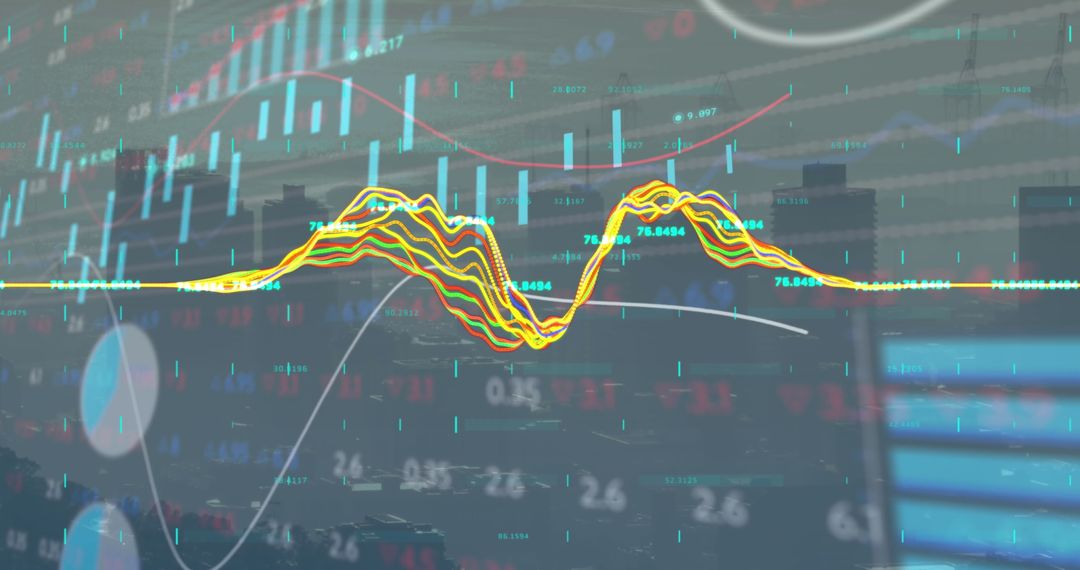
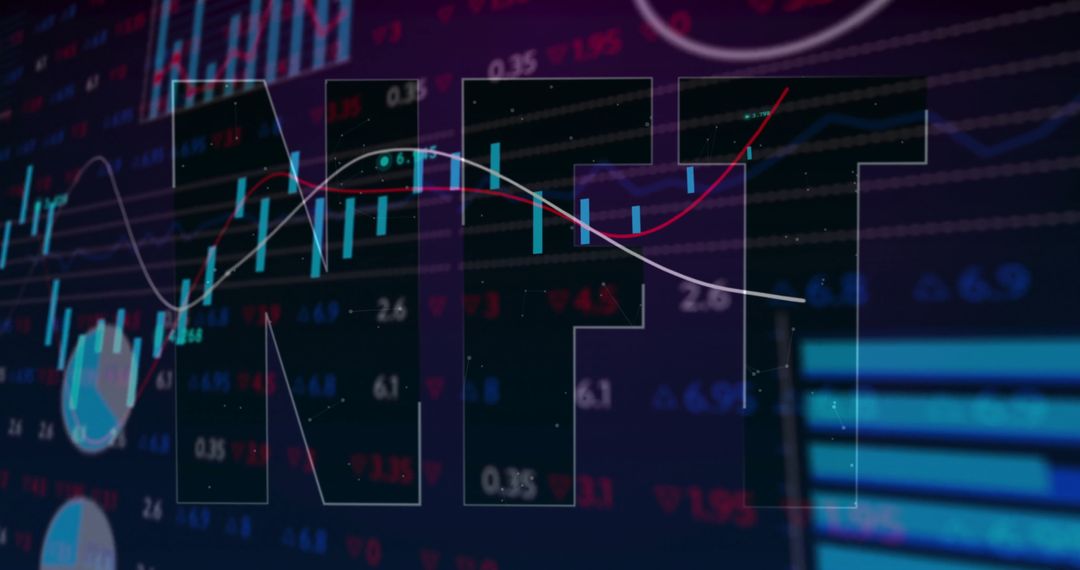
- Digital Dashboard with Candlestick and Line Graphs for Financial Analysis
Digital Dashboard with Candlestick and Line Graphs for Financial Analysis Image
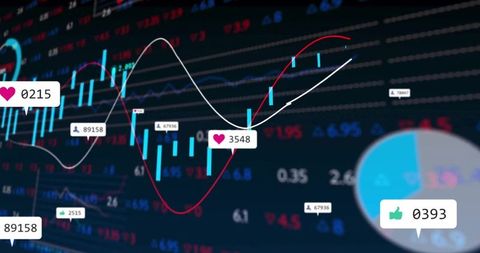
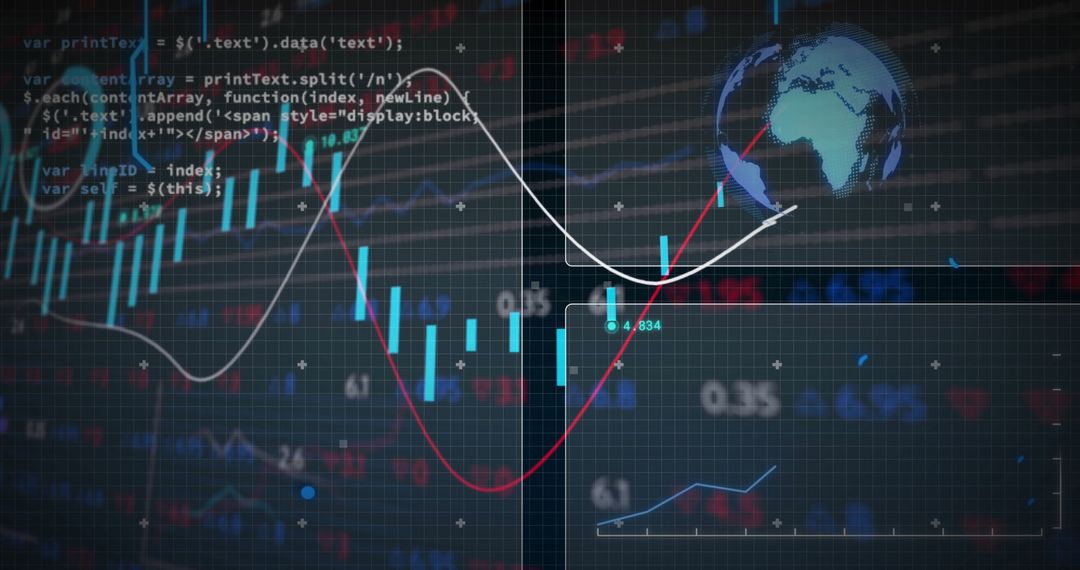
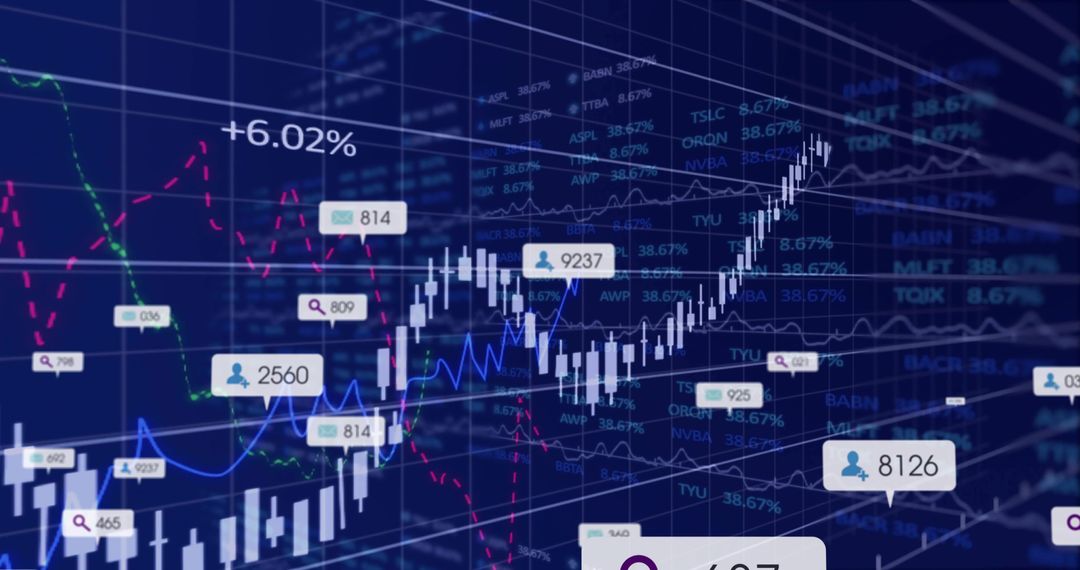
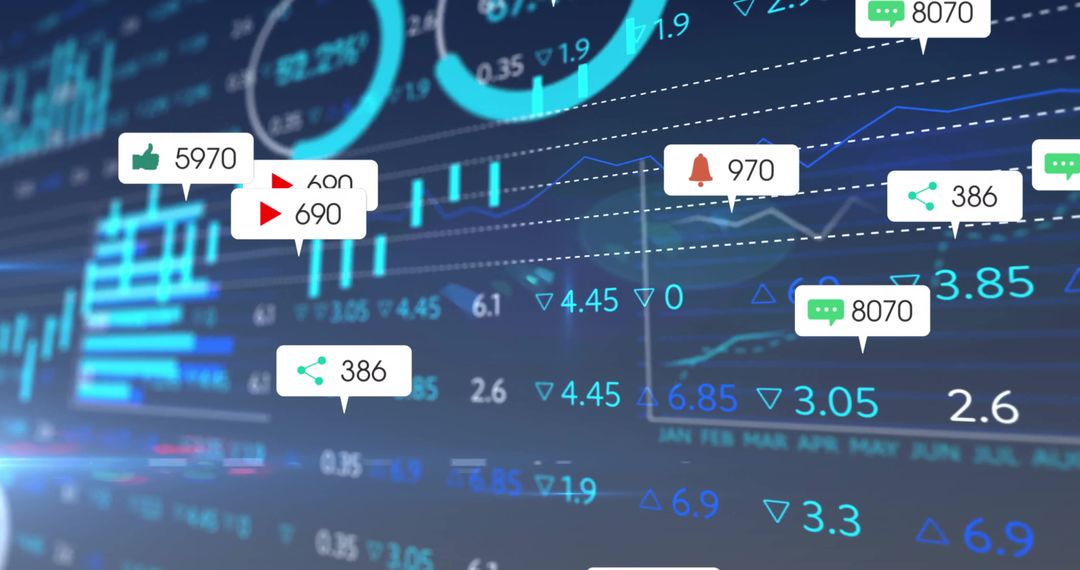
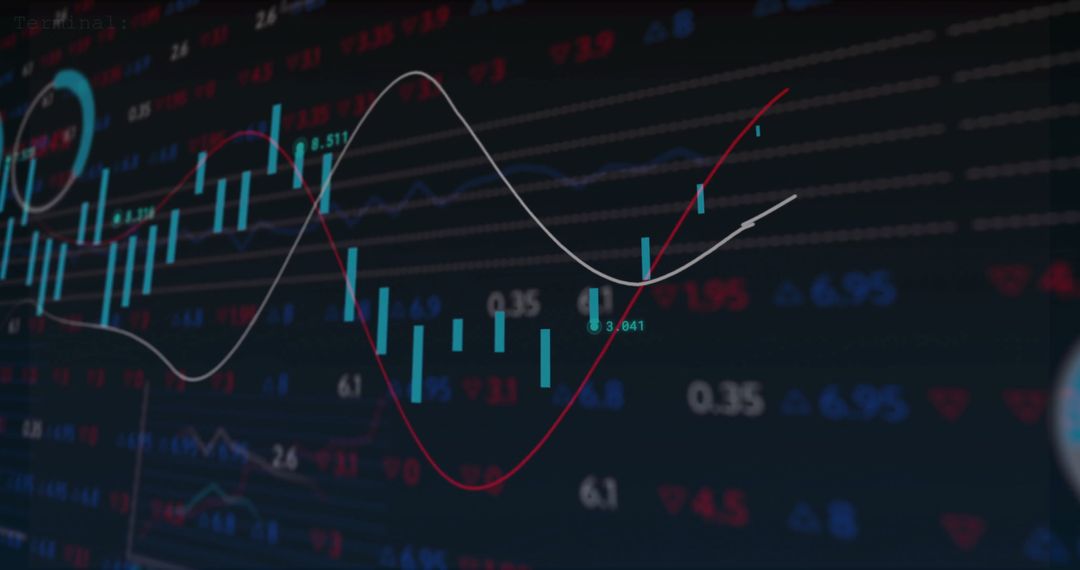
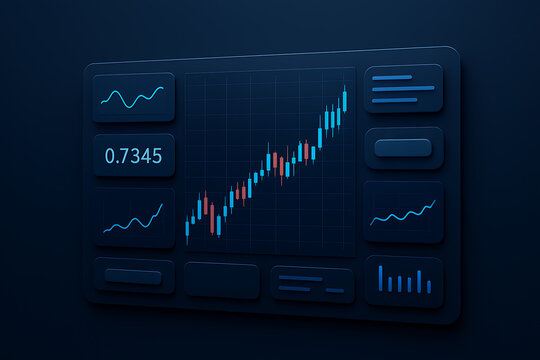
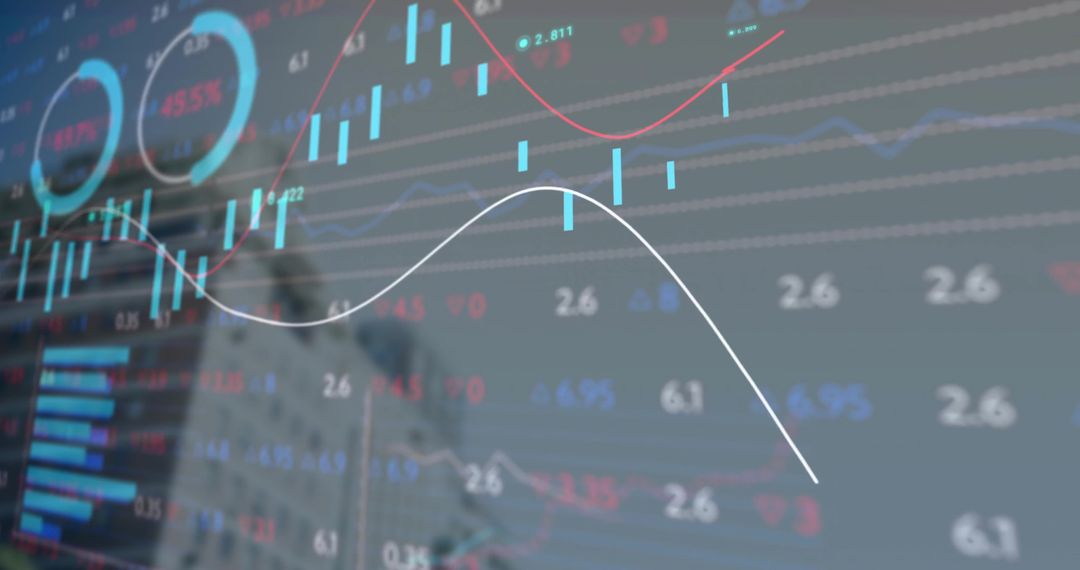
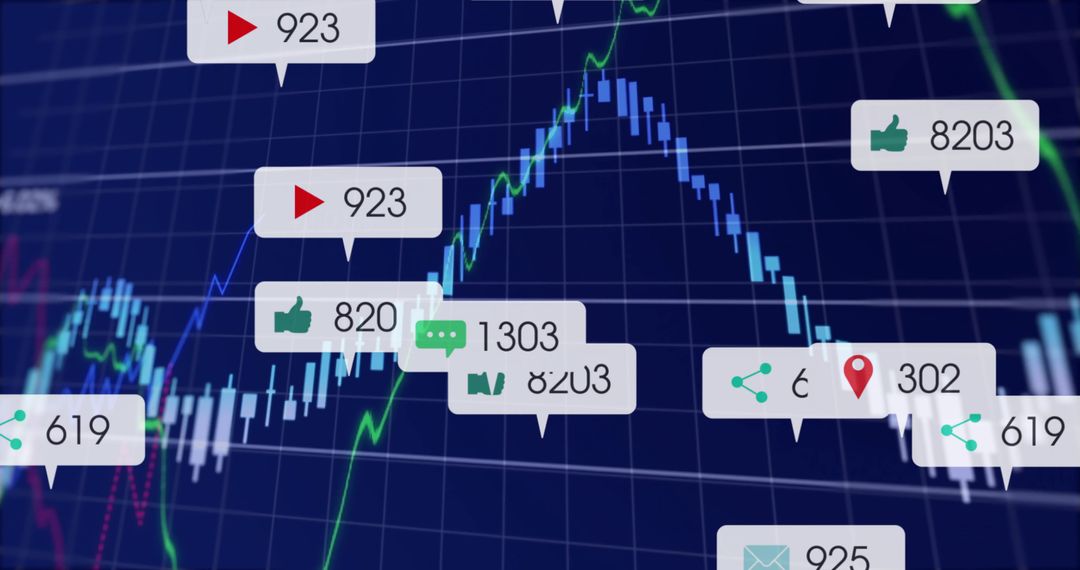
This image showcases a financial dashboard featuring candlestick charts alongside line graphs on a digital interface, highlighting data points connected to social media engagement metrics. The vibrant and dynamic layout is excellent for presentations on financial analytics, technology innovation, or online stock trading systems. It can be useful for marketing materials related to financial platforms or educational content emphasizing data visualization in economics.
Powered by 


0
downloads
downloads
Tags:
More
Credit Photo
If you would like to credit the Photo, here are some ways you can do so
Text Link
photo Link
<span class="text-link">
<span>
<a target="_blank" href=https://pikwizard.com/photo/digital-dashboard-with-candlestick-and-line-graphs-for-financial-analysis/8727a17b84ed4b0f4aa0c06b4b246cb9/>PikWizard</a>
</span>
</span>
<span class="image-link">
<span
style="margin: 0 0 20px 0; display: inline-block; vertical-align: middle; width: 100%;"
>
<a
target="_blank"
href="https://pikwizard.com/photo/digital-dashboard-with-candlestick-and-line-graphs-for-financial-analysis/8727a17b84ed4b0f4aa0c06b4b246cb9/"
style="text-decoration: none; font-size: 10px; margin: 0;"
>
<img src="https://pikwizard.com/pw/medium/8727a17b84ed4b0f4aa0c06b4b246cb9.jpg" style="margin: 0; width: 100%;" alt="" />
<p style="font-size: 12px; margin: 0;">PikWizard</p>
</a>
</span>
</span>
Free (free of charge)
Free for personal and commercial use.
Author: Awesome Content
Similar Free Stock Images

Premium


Premium


Premium


Premium


Premium


Premium


Premium


Premium


Premium


Premium


Premium


Premium


Premium


Premium


Premium


Premium


Premium


Premium


Premium


Premium


Premium


Premium

Premium


Premium