
- Home >
- Stock Photos >
- Digital Dashboard with Charts and Data Visualizations on Gradient
Digital Dashboard with Charts and Data Visualizations on Gradient Image
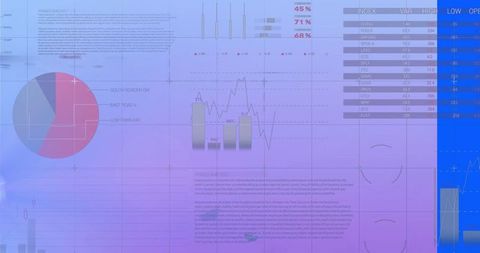
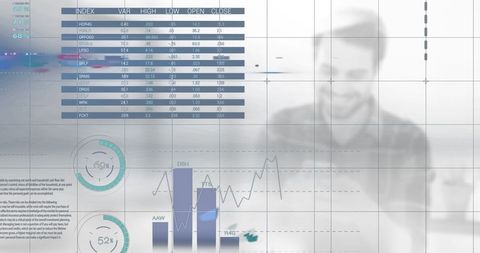
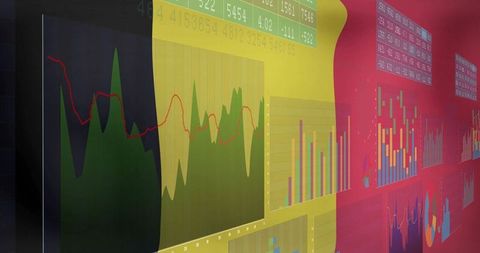
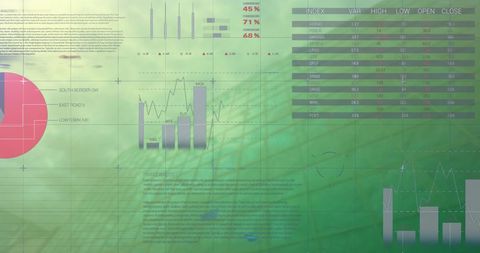
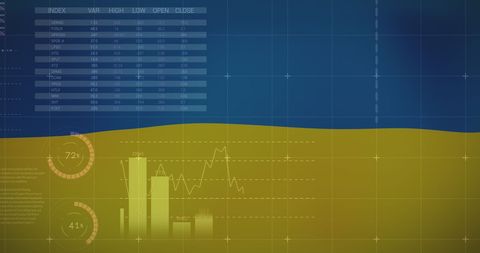
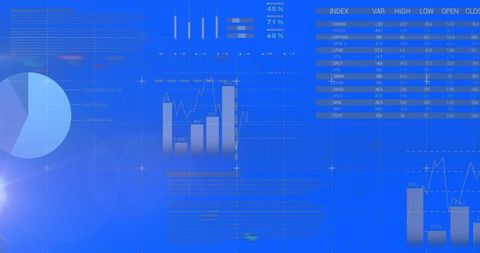
Digital dashboard displays variety of charts including pie charts, bar charts, and line charts against a purple blue gradient. Data and statistics tools are useful choice for presentations and design that focus on analytics, technological trends, and innovative concepts. Useful in illustrating complex data metrics and performance tracking in business contexts.
Powered by 


downloads
Tags:
More
Credit Photo
If you would like to credit the Photo, here are some ways you can do so
Text Link
photo Link
<span class="text-link">
<span>
<a target="_blank" href=https://pikwizard.com/photo/digital-dashboard-with-charts-and-data-visualizations-on-gradient/6bec36499819f3ff82a2a1b8221be7ea/>PikWizard</a>
</span>
</span>
<span class="image-link">
<span
style="margin: 0 0 20px 0; display: inline-block; vertical-align: middle; width: 100%;"
>
<a
target="_blank"
href="https://pikwizard.com/photo/digital-dashboard-with-charts-and-data-visualizations-on-gradient/6bec36499819f3ff82a2a1b8221be7ea/"
style="text-decoration: none; font-size: 10px; margin: 0;"
>
<img src="https://pikwizard.com/pw/medium/6bec36499819f3ff82a2a1b8221be7ea.jpg" style="margin: 0; width: 100%;" alt="" />
<p style="font-size: 12px; margin: 0;">PikWizard</p>
</a>
</span>
</span>
Free (free of charge)
Free for personal and commercial use.
Author: Authentic Images
Similar Free Stock Images

Premium


Premium


Premium


Premium


Premium


Premium


Premium


Premium


Premium


Premium


Premium


Premium

Premium


Premium


Premium

Premium


Premium


Premium

Premium


Premium


Premium

Premium


Premium


Premium


Premium


Explore More Free Stock Images